
FUNDAMENTAL OVERVIEW
Oil prices stabilized in the $80–90 range this week as G7 countries began discussing the possibility of releasing emergency oil reserves to ease pressure on the market. If it happens, the release would be the largest in history.
For now, the mere discussion seems to be capping the upside, but no concrete action has been taken yet. It looks like they are mainly trying to “jawbone” oil prices by keeping the option on the table and signalling that they’re ready to act if needed.
Even if they do go ahead with the release, it would likely be only a short-term fix. In fact, the market could even see a classic “sell the fact” reaction, where prices move higher after the reserves are actually released.
The underlying issue remains the closure of the Strait of Hormuz. Until there is a genuine de-escalation, the downside in oil prices is likely to remain limited.
CRUDE OIL TECHNICAL ANALYSIS – DAILY TIMEFRAME
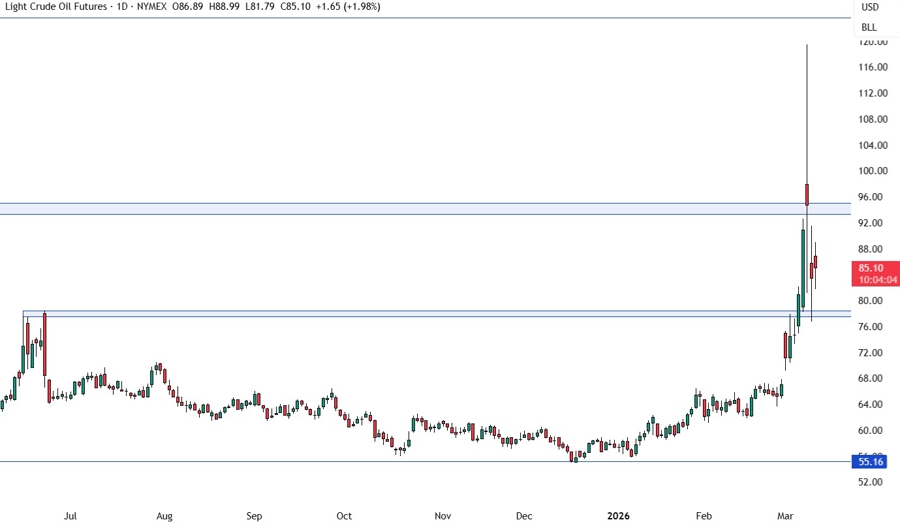
On the daily chart, we can see that crude oil dropped all the way back to last June’s high and bounced. If the price rises back to the key 94.00 resistance zone, we can expect the sellers to step in with a defined risk above the resistance to position for a drop back into the 78.00 support targeting a breakout. The buyers, on the other hand, will look for a break higher to increase the bullish bets into new highs.
CRUDE OIL TECHNICAL ANALYSIS – 4 HOUR TIMEFRAME
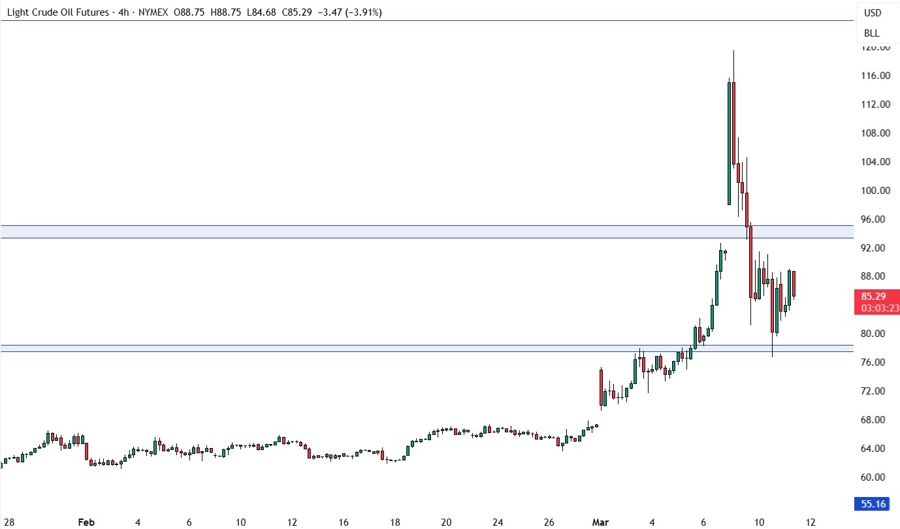
On the 4 hour chart, we can see that the price stabilised as the discussions about a G7 oil reserves release capped the upside. There’s not much else we can glean from this timeframe, so we need to zoom in to see some more details.
CRUDE OIL TECHNICAL ANALYSIS – 1 HOUR TIMEFRAME
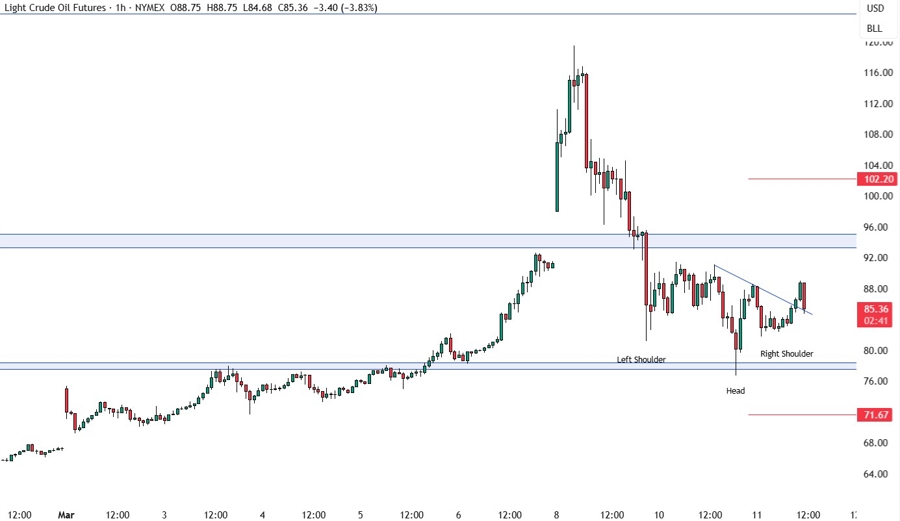
On the 1 hour chart, we can see that the recent price action might have formed an inverted head and shoulders pattern. The price has already broken above the neckline and it’s now retesting it. The buyers will likely step in here with a defined risk below the most recent swing low to position for a rally into new highs. The sellers, on the other hand, will want to see the price falling back below the neckline to pile in for a drop back into the 78.00 support. The red lines define the average daily range for today.
UPCOMING CATALYSTS
Today we have the US CPI report. Tomorrow, we get the latest US Jobless Claims figures. On Friday, we conclude the week with the US PCE price index, the University of Michigan Consumer Sentiment survey and the Job Openings data. As a reminder, the market focus right now is solely on the US-Iran war, so the data might not matter much.
