
Fundamental Overview
Silver eventually erased almost the entire weekly gain as the short squeeze came to an end. Fundamentally, nothing has changed although the probabilities for a December cut fell to just 40% in the final part of last week.
The market participants continue to wait for the key US data ahead of the December FOMC. Strong US data, especially on the labour market side, should keep weighing on silver as it would keep the market speculating on rate cuts pause. Conversely, weak data is likely to support the precious metal as it would give the Fed more reasons to keep cutting rates.
In the bigger picture, silver should remain in an uptrend as real yields will likely continue to fall amid the Fed’s dovish reaction function. But in the short term, a further hawkish repricing in interest rate expectations should keep weighing on the market.
Silver Technical Analysis – Daily Timeframe
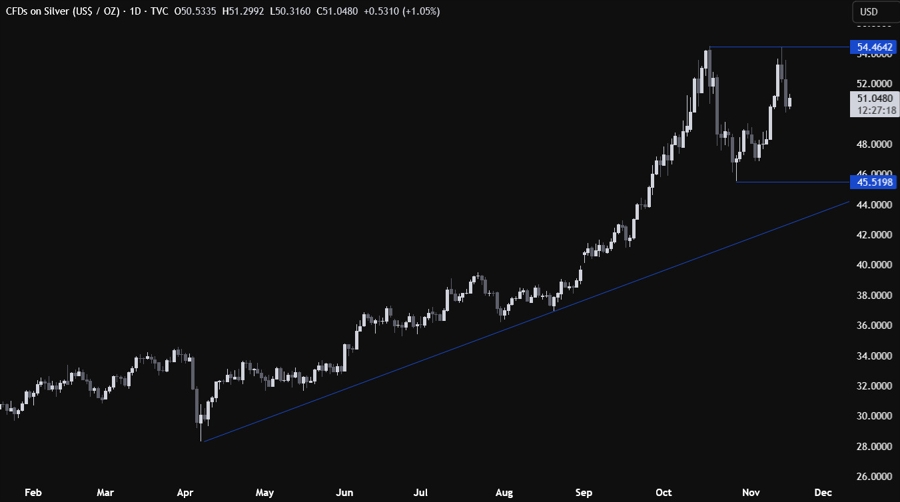
On the daily chart, we can see that silver got rejected right around the all-time highs as the double top now looks even clearer. The target for the sellers should be the major trendline around the 45.00 level. If the price gets there, we can expect the buyers to lean on the trendline with a defined risk below it to position for a rally into a new all-time high.
Silver Technical Analysis – 4 hour Timeframe
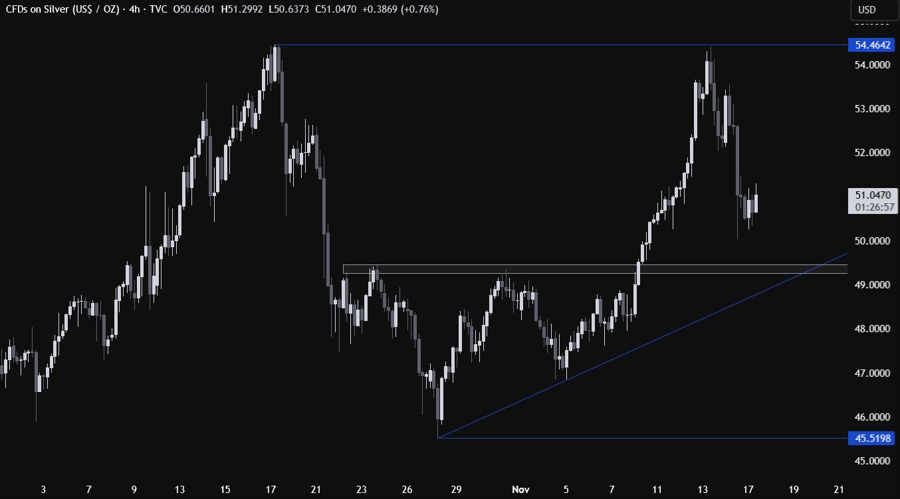
On the 4 hour chart, we can see that we have a strong support zone around the 49.50 level. If the price gets there, we can expect the buyers to step in with a defined risk below the trendline to position for a rally into a new all-time high. The sellers, on the other hand, will look for a break lower to increase the bearish bets into the major trendline.
Silver Technical Analysis – 1 hour Timeframe
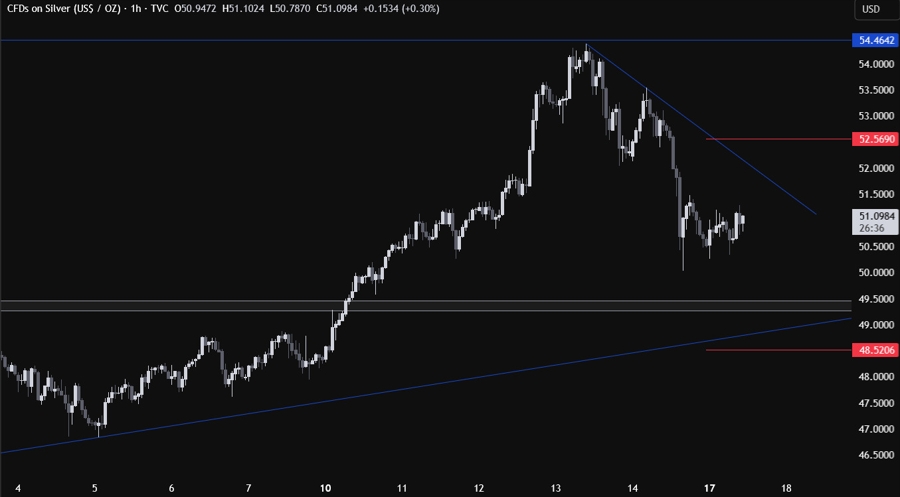
On the 1 hour chart, we can see that we have a minor downward trendline defining the bearish momentum on this timeframe. We can expect the sellers to lean on the trendline with a defined risk above it to keep pushing into new lows, while the buyers will look for a break higher to pile in for a rally into the all-time highs. The red lines define the average daily range for today.
Upcoming Catalysts
Tomorrow we get the weekly ADP jobs data. On Wednesday, we have the FOMC meeting minutes. On Thursday, we get the September NFP report and maybe the US Jobless Claims data. On Friday, we conclude the week with the US Flash PMIs.
