
FUNDAMENTAL OVERVIEW
Silver pulled all the way back into a key swing level around the 92.00 handle as some renewed tariff uncertainty and the risk of a military escalation between US and Iran has kept the market supported.
Nonetheless, the bullish momentum from the Friday’s US Supreme Court decision seems to have already waned given no changes to the big picture.
In fact, Trump has already imposed new tariffs under a different law, and the tariff deals remain in place. The new levies actually reduce the effective average tariff rate, so at the margin it could be a positive.
The market might remain supported in the short-term amid some uncertainty, but I don’t see material changes to justify a rally back to all-time highs, at the moment. The real risks remain a potential US-Iran military escalation which could take silver prices to new highs or a hawkish repricing on stronger US data which would have a negative effect on the market.
Fed’s Waller mentioned that he would change his dovish stance in case the strong January’s jobs data is repeated in February, so next week’s NFP report is going to be a key risk event for silver.
SILVER TECHNICAL ANALYSIS – DAILY TIMEFRAME
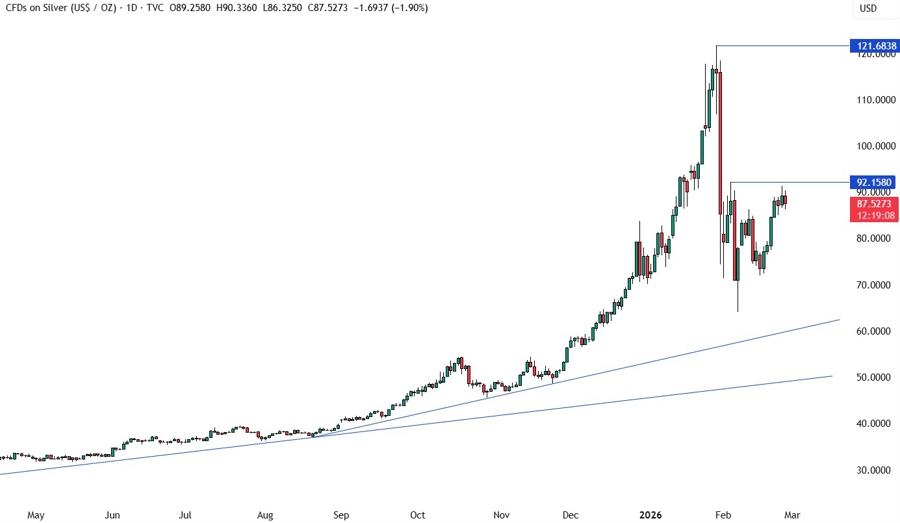
On the daily chart, we can see that silver pulled all the way back to the key swing level at 92.15. This is where we can expect the sellers to step in with a defined risk above the level to position for a drop into the major trendline around the 60.00 handle. The buyers, on the other hand, will want to see the price breaking higher to increase the bullish bets into a new record high next.
SILVER TECHNICAL ANALYSIS – 4 HOUR TIMEFRAME
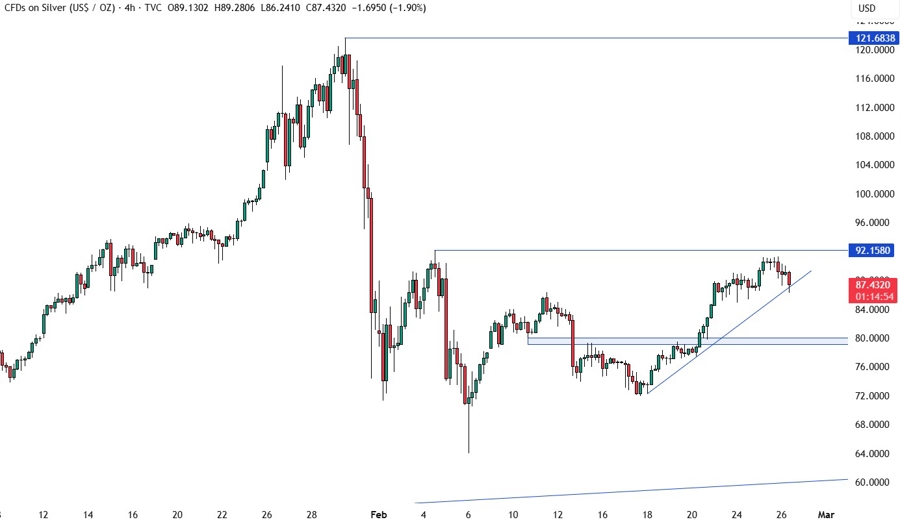
On the 4 hour chart, we can see the price is rejecting a minor upward trendline as the buyers are stepping in with a defined risk below the trendline to position for a break above the 92.15 level. The sellers will look for a break below the trendline to extend the drop into the 80.00 support next.
SILVER TECHNICAL ANALYSIS – 1 HOUR TIMEFRAME
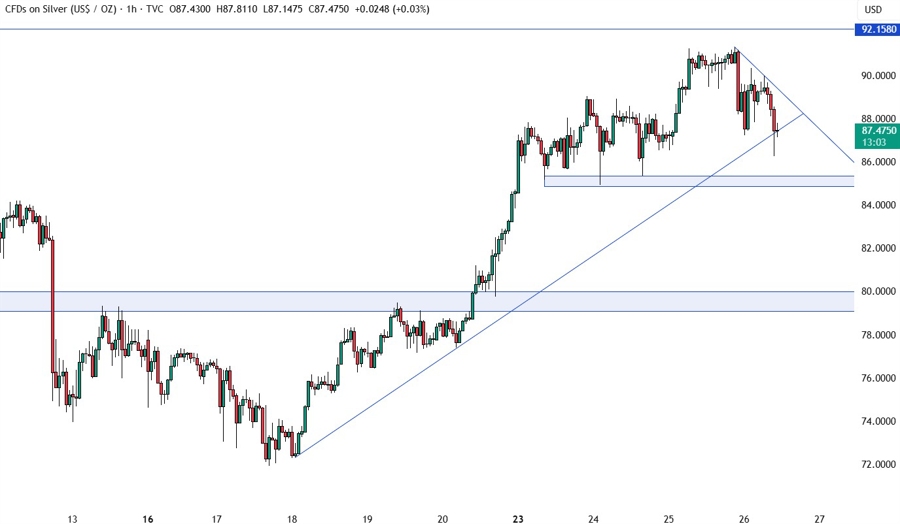
On the 1 hour chart, we can see a minor support zone around the 85.00 level. If the price were to break below the trendline, we can expect the buyers to step in around the support with a defined risk below it to position for a rally into new highs. A break above the minor downward trendline should see the buyers increasing their bullish bets. The sellers, on the other hand, will likely continue to lean on the downward trendline to keep pushing into new lows The red lines define the average daily range for today.
UPCOMING CATALYSTS
Today we have the third round of US-Iran talks and the US Jobless Claims data. Tomorrow, we conclude the week with the US PPI report.
