
FUNDAMENTAL OVERVIEW
Silver has been outperforming gold recently amid tailwinds like lower real yields, looser financial conditions and lower US dollar. The momentum and volatility have certainly not been the same since the late January’s crash. The key difference has been the Fed which has pivoted away from the dovish stance.
Nonetheless, silver should remain supported amid the positive US-Iran deal expectations which should keep any downside limited.
Everything now hinges on US-Iran talks. If negotiations were to collapse again, we might get a bigger pullback, but as long as the ceasefire holds, the losses should remain limited. On the other hand, a peace deal might give silver another boost to extend the rally into new highs. For a much stronger rally though, silver would need the Fed to pivot back to a dovish stance.
SILVER TECHNICAL ANALYSIS – DAILY TIMEFRAME
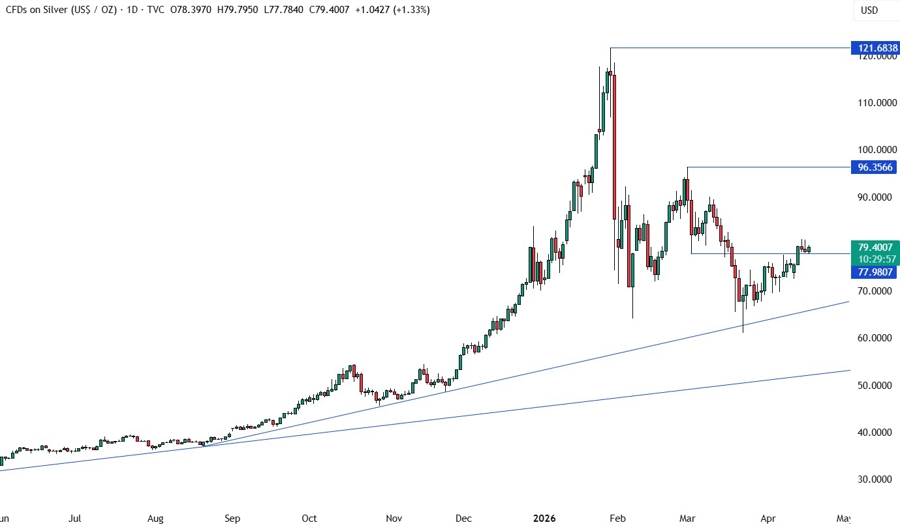
On the daily chart, we can see that silver is continuing to slowly edge higher amid the positive US-Iran expectations. The natural target for the buyers is the major swing level at 96.35. If the price gets there, we can expect the sellers to step in with a defined risk above the swing level to position for a drop back into the 70.00 handle. The buyers, on the other hand, will look for a break to increase the bullish bets into the 120.00 level next.
SILVER TECHNICAL ANALYSIS – 4 HOUR TIMEFRAME
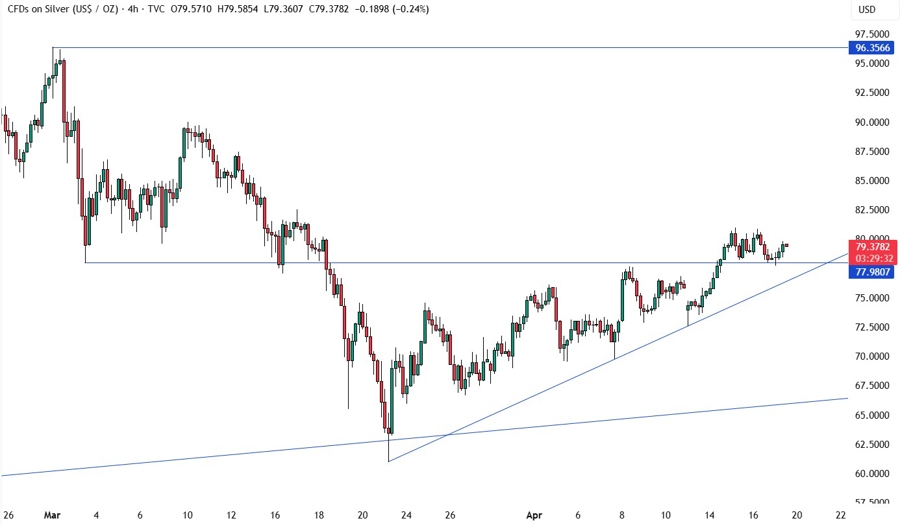
On the 4 hour chart, we can see that the price broke above the key 77.98 resistance opening the door for more upside. We have an upward trendline defining the bullish momentum. If we get a pullback into the trendline, we can expect the buyers to lean on it with a defined risk below it to keep pushing into new highs. The sellers, on the other hand, will look for a break to pile in for a drop into the major trendline around the 67.50 level.
SILVER TECHNICAL ANALYSIS – 1 HOUR TIMEFRAME
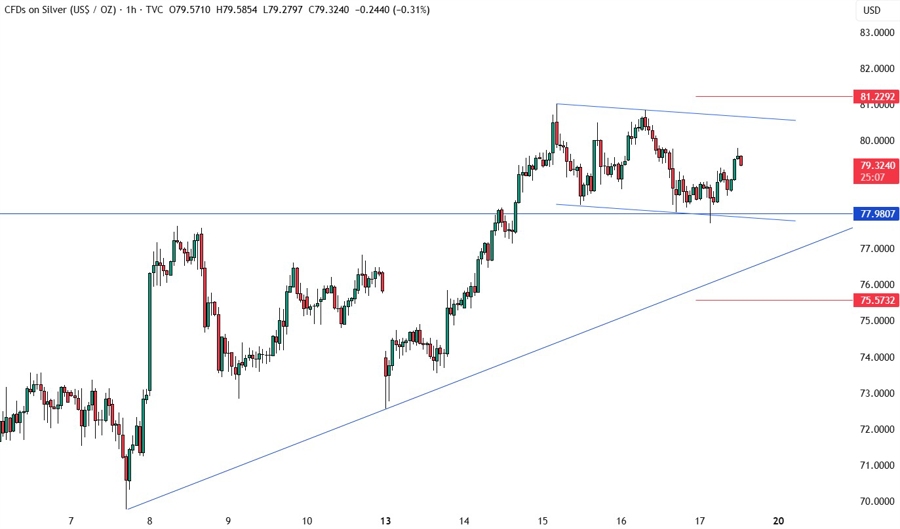
On the 1 hour chart, the recent consolidation above the 77.98 level might have formed a bullish flag. We can expect the buyers to step in around the lower bound of the pattern to keep pushing into new highs and increase the bullish bets on a break above the upper bound of the flag.
The sellers, on the other hand, will look for a break below the lower bound of the flag to extend the pullback into the upward trendline targeting a break below it. The red lines define the average daily range for today.


