
How the mighty have fallen. Silver was the talk of the town as it surged by roughly 60% in January trading, hitting highs of just above $120. That is a far cry from where we are trading now, with the precious metal suffering another 5% drop today and poised for six straight daily losses in nine.
The low point this year was in early February when we saw the volatile selling drag price down to near $64. This time around, silver is still hovering above $70 on the week. However, the chart is telling a story that the downside drop this week could be even more damaging for the outlook and price momentum in silver than last month.
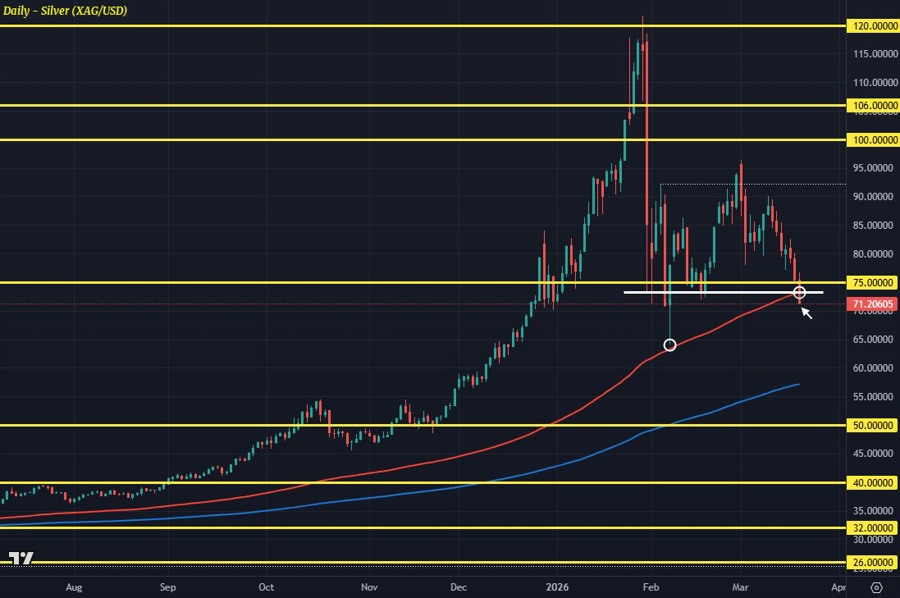
The biggest thing to note on the chart is that we're seeing silver take a run below its 100-day moving average (red line) of $73.19. If sustained, this will mark the first time that the precious metal trades below either of its key daily moving averages since April 2025. That speaks to how long this gradual then suddenly parabolic upside momentum has been building up for silver.
And adding to that, there seems to be a neckline break around the $73.00-25 region as well. And that just compounds the impact of the drop we're seeing today, that is if it holds into the daily close.
This is the most important thing to watch out for now if you're looking at precious metals.
The drop in gold is less profound of course, with it being down just a little over 2% to $4,715 currently. But as seen before this, a negative drag in silver also has the pull factor in shoving gold prices lower as well - even if not as much.
It's going to be quite a battle for dip buyers in trying to push this one across the line. Otherwise, it seems like there is going to be more trouble up ahead for silver before the turn of the tide. In other words, it looks like things will get worse still before they get better again.
