
FUNDAMENTAL OVERVIEW
Gold rallied on Friday following a barrage of positive news on the US-Iran front that seemed to point to an imminent deal after Iran announced the reopening of the Strait of Hormuz.
The positive price action reversed heading into the weekend though after Trump said that the US would keep the blockade of the Strait of Hormuz in place until a deal with Iran was finalized. Traders might have hedged into the weekend due the risk of an escalation. This is exactly what happened as Iran reclosed the Strait in retaliation to the US blockade.
This resulted in a negative gap when the markets reopened yesterday, and despite the positive developments and the expected US-Iran talks tomorrow in Islamabad, the uncertainty keeps capping the upside in gold.
The price action continues to be driven by US-Iran headlines, and this is unlikely to change until we get an official resolution. For now, the downside in gold should remain limited amid positive expectations and a resolution should trigger a rally towards the 5,000 level. On the other hand, if the ceasefire doesn’t get extended and the war resumes, gold price are likely to quickly fall back into the 4,000 level.
GOLD TECHNICAL ANALYSIS – DAILY TIMEFRAME
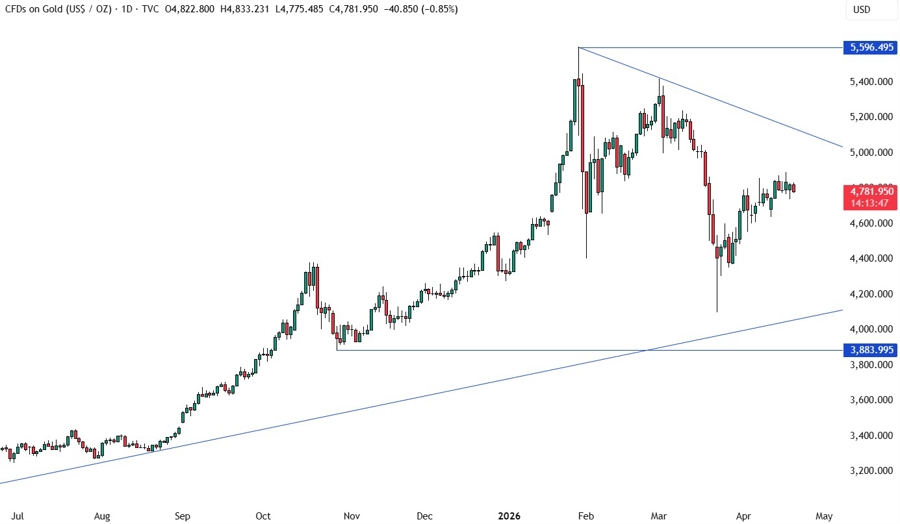
On the daily chart, we can see that gold just lacks momentum to extend the rally into the 5,000 level amid US-Iran uncertainty. If the price gets there, we can expect the sellers to lean on the downward trendline with a defined risk above it to position for a drop into the major upward trendline around the 4,100 level. The buyers, on the other hand, will look for a break higher to increase the bullish bets into the 5,400 level next.
GOLD TECHNICAL ANALYSIS – 4 HOUR TIMEFRAME
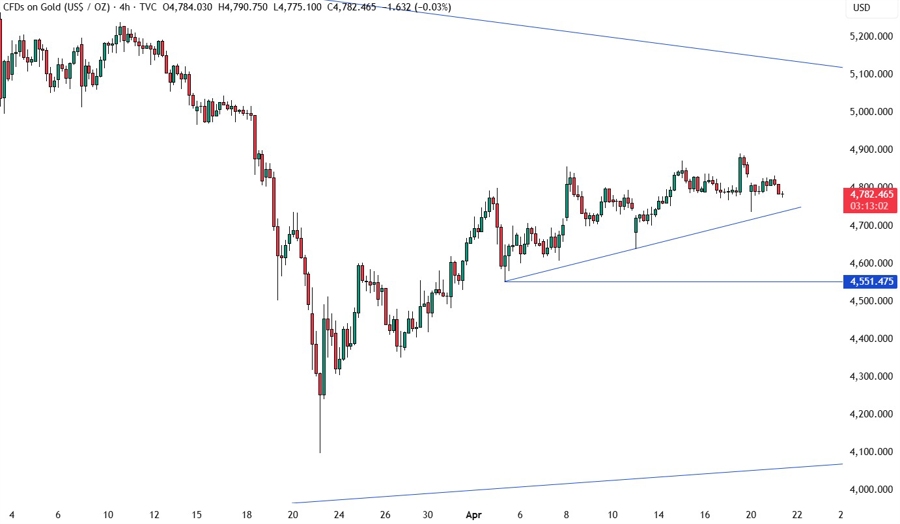
On the 4 hour chart, we have a minor upward trendline acting as support. The buyers will likely lean on the trendline with a defined risk below it to keep pushing into the major downward trendline. The sellers, on the other hand, will look for a break to extend the pullback into the 4,550 level next.
GOLD TECHNICAL ANALYSIS – 1 HOUR TIMEFRAME
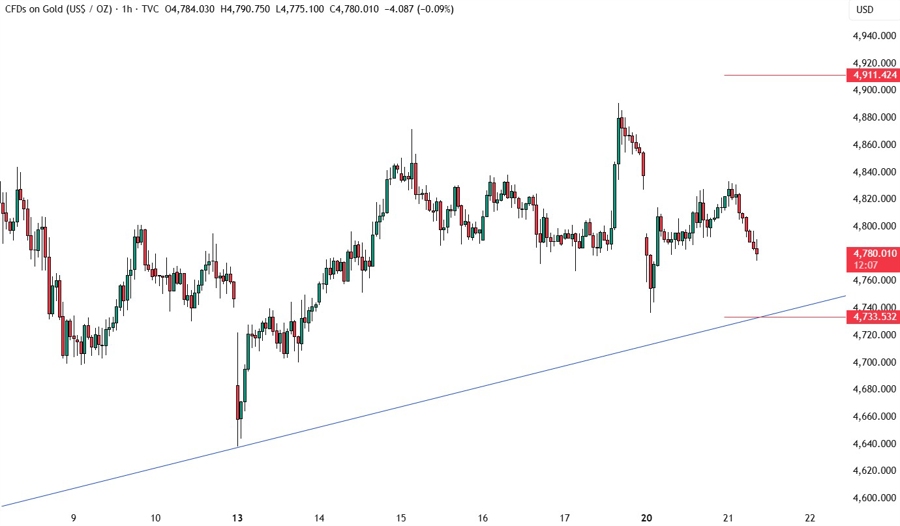
On the 1 hour chart, there’s not much we can add here but from a risk management perspective, the buyers will have a better risk to reward setup around the upward trendline to position for new highs, while the sellers will need a break to open the door for new lows. The red lines define the average daily range for today.
UPCOMING CATALYSTS
Today we have the US Retail Sales. Tomorrow, we should have the US-Iran talks in Islamabad. On Thursday, we get the latest US Jobless Claims figures and the US PMIs. The focus remains on US-Iran headlines ahead of the ceasefire deadline tomorrow at midnight.


