
FUNDAMENTAL OVERVIEW
Oil prices recouped all last week’s losses as risks of a US-Iran conflict increased. In fact, we got a report from Axios suggesting that a war between the U.S. and Iran now appears increasingly likely. According to the sources cited, there is currently no sign of a diplomatic breakthrough between Washington and Tehran which is irritating Trump.
They also noted that, given Trump’s recent military build-up and escalated rhetoric, it may be difficult for him to de-escalate without Iran offering significant concessions on its nuclear program. The report added that any military operation in Iran would be massive, involving a weeks-long campaign that would resemble a full-fledged war.
If a military conflict were to break out, we would see oil prices skyrocket due to the risk of disruption in the Strait of Hormuz, especially in light of the recent military drills. Traders are piling in into oil longs given the weekend risk.
In fact, the Axios report added at the end that U.S. officials said after Tuesday's talks that Iran needs to come back with a detailed proposal in two weeks. But here’s the kicker: last June, the White House set a two-week window for Trump to decide between further talks or strikes. Three days later, he launched Operation Midnight Hammer.
Another important event is tomorrow’s potential US Supreme Court decision on Trump’s tariffs. In fact, if the Supreme Court were to rule against the tariffs, we will likely see oil prices surging on positive growth expectations.
CRUDE OIL TECHNICAL ANALYSIS – DAILY TIMEFRAME
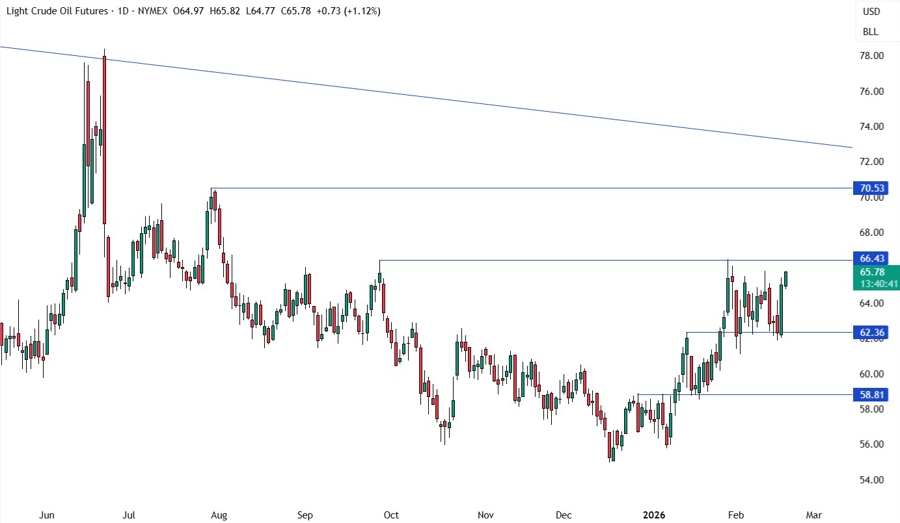
On the daily chart, we can see that crude oil bounced at the support zone around the 62.35 level and it’s now approaching the key 66.43 resistance. That’s where we can expect the sellers to step in with a defined risk above the resistance to position for a drop back into the support. The buyers, on the other hand, will look for a break higher to increase the bullish bets into the 70.50 level next.
CRUDE OIL TECHNICAL ANALYSIS – 4 HOUR TIMEFRAME
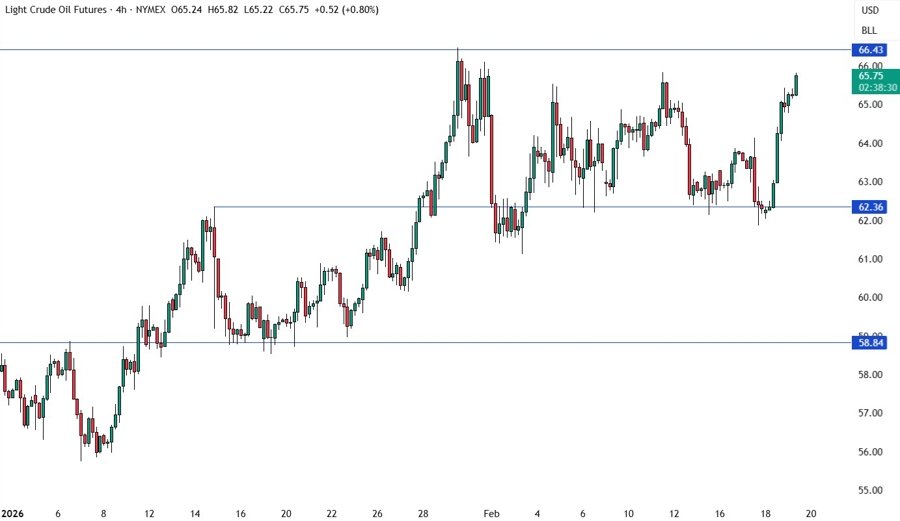
On the 4 hour chart, we can see more clearly the rangebound price action between the 62.35 support and the 66.43 resistance. Market participants will likely continue to play the range until we get a breakout on either side.
CRUDE OIL TECHNICAL ANALYSIS – 1 HOUR TIMEFRAME
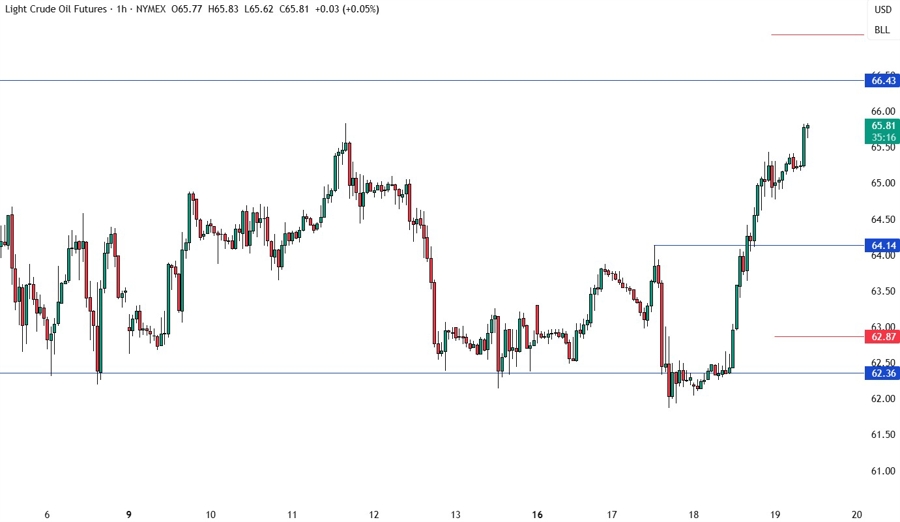
On the 1 hour chart, there’s not much we can add here as the sellers will likely step in around the resistance to position for a drop back into the support, while the buyers will look for a breakout to extend the rally into the 70.50 level next. The red lines define the average daily range for today.
UPCOMING CATALYSTS
Today we get the latest US Jobless Claims figures. Tomorrow, we conclude the week with the US Q4 GDP, the US PCE price index for December, the US Flash PMIs and a potential US Supreme Court decision on Trump’s tariffs. Watch out for US-Iran headlines as well.


