
FUNDAMENTAL OVERVIEW
Oil prices have been pulling back since Monday as the positive US-Iran deal expectations kept weighing on the market. The second round of talks is expected to happen before the April 22 ceasefire deadline. Trump mentioned today that they might have a meeting this weekend.
In the meantime, we got reports that US and Iranian negotiators made progress in talks on Tuesday and they were moving closer to a framework agreement to end the war. A US official has also mentioned that if a framework agreement is reached, the ceasefire would need to be extended to negotiate the details of a comprehensive deal.
Moreover, Reuters reported yesterday that Iran could let ships sail freely through the Omani side of the Strait of Hormuz without risk of attacks under the proposals it has offered in talks with the US, providing a deal is secured to prevent renewed conflict.
Everything now hinges on US-Iran talks. If negotiations were to collapse again, we might see a short-term rally in crude oil, but as long as the ceasefire holds, the upside could remain limited. On the other hand, a peace deal is should increase the bearish momentum and might take WTI oil back to pre-war levels.
CRUDE OIL TECHNICAL ANALYSIS – DAILY TIMEFRAME
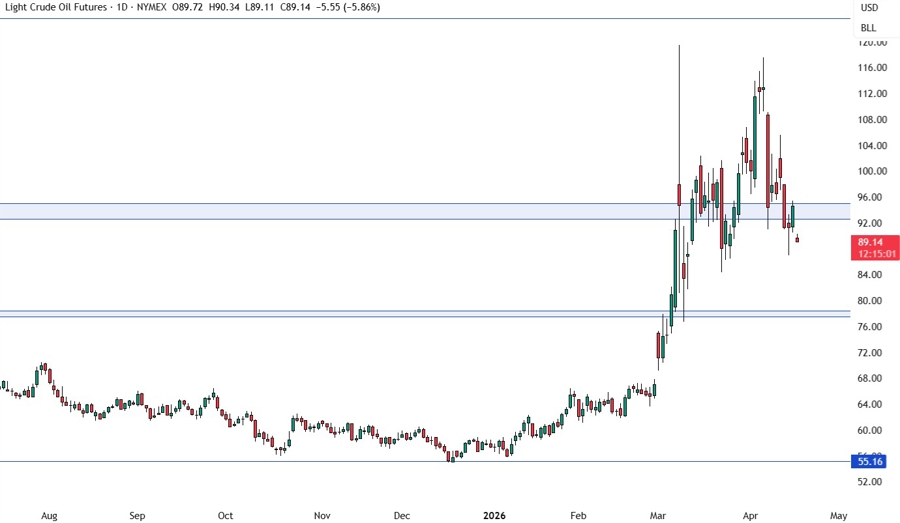
On the daily chart, we can see that crude oil is now trading below the key 93.00 support zone which now turned resistance. The breakout opened the door for a drop into the 78.00 support next. There’s not much more we can glean from this timeframe, so we need to zoom in to see some more details.
CRUDE OIL TECHNICAL ANALYSIS – 4 HOUR TIMEFRAME
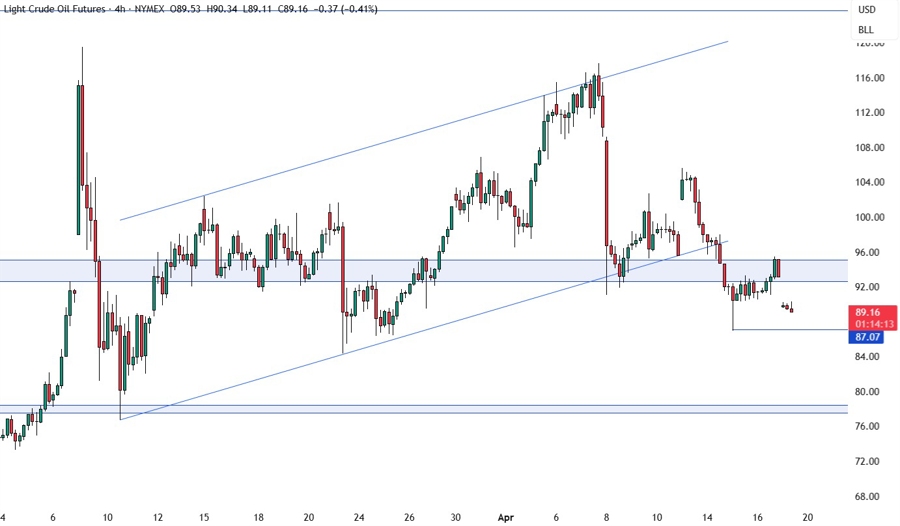
On the 4 hour chart, we can see the price broke below the rising channel and the 93.00 support zone amid US-Iran deal optimism and that has turned the bias more bearish. If we get another pullback into the 93.00 zone, we can expect the sellers to step in with a defined risk above it to position for a drop into the 78.00 support. The buyers, on the other hand, will look for a break higher to pile in for a rally into the 105.00 level.
CRUDE OIL TECHNICAL ANALYSIS – 1 HOUR TIMEFRAME
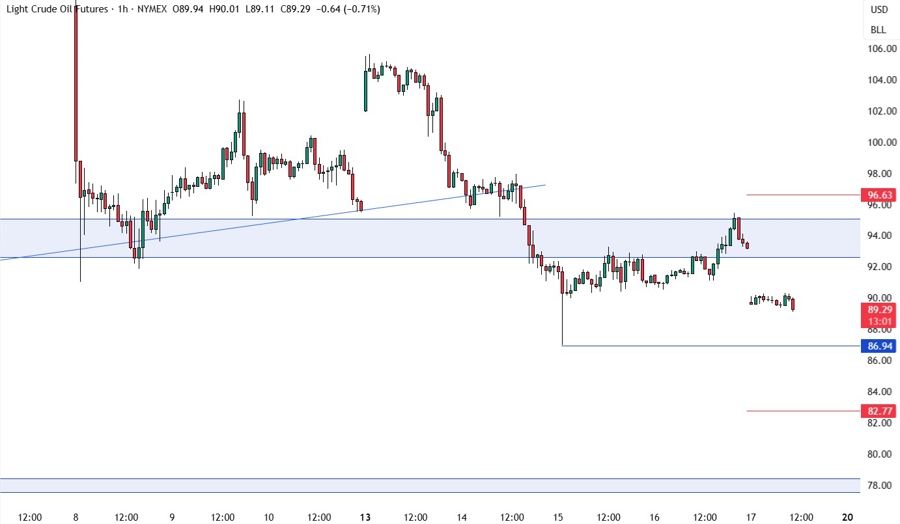
On the 1 hour chart, there’s not much we can add here but a break below the recent low at 86.95 could see the bearish momentum increasing as more sellers pile in to target the 78.00 support. The red lines define the average daily range for today.


