
FUNDAMENTAL OVERVIEW
Oil prices surged yesterday after early reports suggested the third round of US–Iran talks had broken down, with Iran reportedly rejecting US demands. Later in the day, however, new headlines indicated that the discussions had actually made significant progress and that another round was scheduled for next week. The prices pulled back on the news but eventually rebounded as traders hedged into the weekend risk as you never know with Trump. This kind of back-and-forth is keeping the market rangebound near the highs with a bullish skew.
If a military conflict were to erupt, oil prices would likely spike sharply, particularly due to the risk of disruption in the Strait of Hormuz, a critical chokepoint for global energy supplies. Conversely, a clear sign of US military de-escalation or a breakthrough in negotiations between Washington and Tehran would likely be needed for prices to retreat toward the $60 level. For now, elevated geopolitical tensions are expected to keep the oil market well supported.
CRUDE OIL TECHNICAL ANALYSIS – DAILY TIMEFRAME
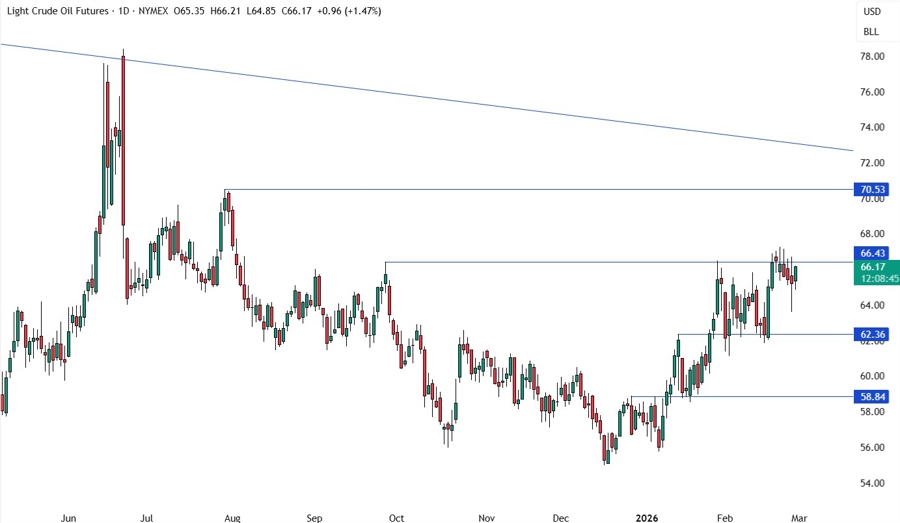
On the daily chart, we can see that crude oil continues to consolidate around the highs as US-Iran tensions persist. We can expect the sellers to continue to step in around the 66.43 resistance with a defined risk above it to target a drop back into the 62.36 support. The buyers, on the other hand, will look for a break higher to increase the bullish bets into the 70.50 level next.
CRUDE OIL TECHNICAL ANALYSIS – 4 HOUR TIMEFRAME
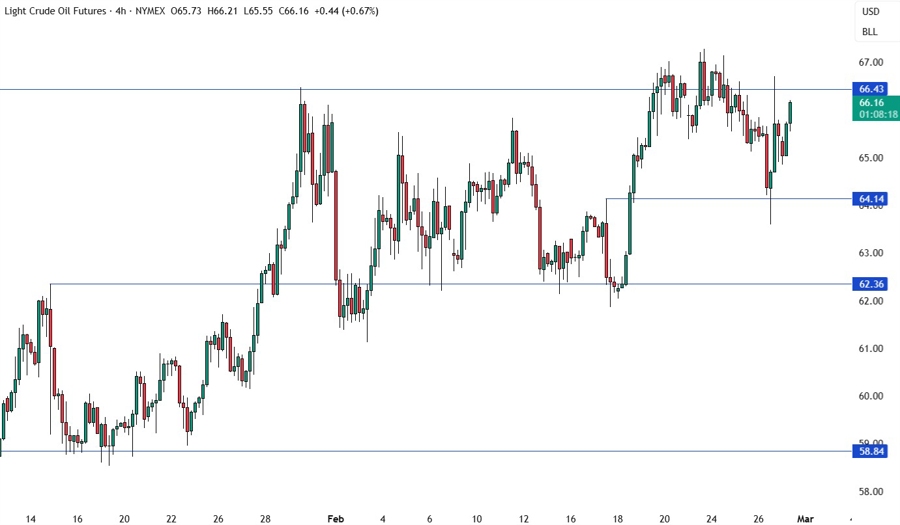
On the 4 hour chart, we can see the price probed below the mid-range support around the 64.14 level but eventually rebounded. There’s not much we can add here as the sellers will continue to step in around the resistance, while the buyers will look for a breakout.
CRUDE OIL TECHNICAL ANALYSIS – 1 HOUR TIMEFRAME
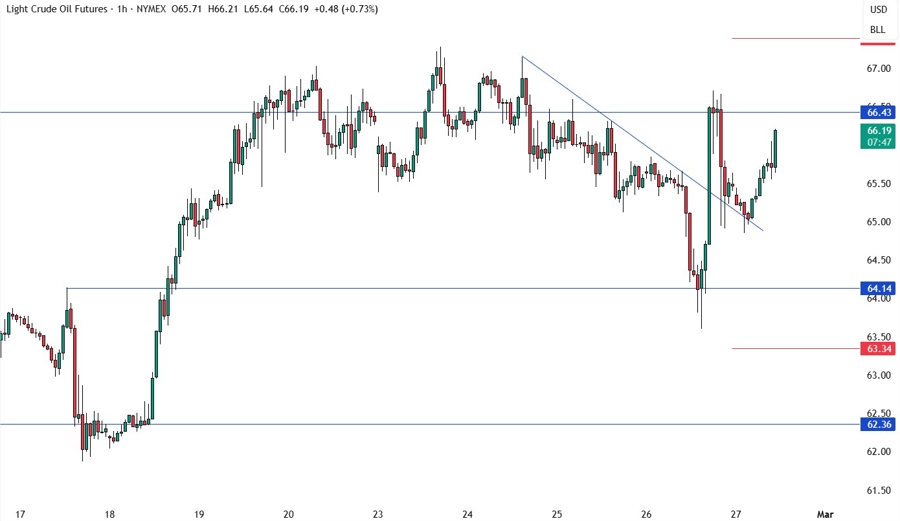
On the 1 hour chart, we can see the price broke above the minor downward trendline and pulled back to retest it before another push to the upside. The price action remains mostly rangebound so there could be many false breaks. From a risk management perspective, the sellers continue to have a better risk to reward setup around the highs, while the buyers around the 62.36 support. The red lines define the average daily range for today.
UPCOMING CATALYSTS
Today we conclude the week with the US PPI report but continue to watch out for US-Iran headlines ahead of the weekend.
