
Silver continues to command global attention as the metal trades near historic highs and investors position for what may be one of the most important phases of its multiyear uptrend. Strong inflows into silver backed ETFs, persistent industrial demand, and a structural supply deficit have all contributed to the current momentum. At the same time, the technical picture on the higher timeframes still reinforces the idea that Silver remains in a dominant bullish structure, even if short term volatility creates deep retracements along the way.
This report examines the long term monthly and weekly charts, explores the macro catalysts behind the move, analyzes SLV’s implied versus actual daily performance for early signs of trend exhaustion, and closes with an important insight from TradeCompass that highlights the line in the sand where Silver’s bullish control may finally be tested.
Macro Catalysts Supporting the Silver Rally
Several major forces continue to align in favor of higher silver prices, creating a backdrop that supports both the long term and intermediate trends.
1. Strong ETF inflows
Investment demand continues to strengthen as silver backed ETFs absorb meaningful quantities of metal. These inflows tighten an already constrained market and often accelerate momentum.
2. Persistent multi year supply deficits
Mine production and recycling have struggled to keep pace with rapidly growing industrial and investment demand. Inventories remain thin in major storage hubs, which allows even moderate waves of buying to create strong upward pressure.
3. Expanding industrial demand
Silver plays a critical role in the solar industry, electronics, EV components, and advanced manufacturing. Photovoltaics alone are projected to consume a substantial share of annual output through the next decade, shifting silver from a traditional precious metal narrative toward a more strategic industrial resource.
4. Macro conditions favoring metals
Markets increasingly expect the Federal Reserve to begin cutting interest rates in 2026. Lower rates and softer real yields reduce the opportunity cost of holding non yielding metals. A weaker dollar and persistent economic uncertainty also keep hard assets attractive to global investors.
5. The psychological impact of the 60 dollar level
Silver’s approach toward the 60 dollar region has increased media coverage and attracted both momentum traders and early profit takers. Round number dynamics can intensify volatility, often producing accelerated moves or temporary shakeouts.
Together, these catalysts create a supportive environment in which pullbacks are more likely to be opportunities rather than early signs of a top.
Silver Futures Monthly Technical Analysis
The monthly chart remains one of the strongest arguments for the continuation of Silver’s long term uptrend. Price has advanced toward the 60 dollar zone, a psychologically loaded level where both breakout interest and profit taking tend to increase. Despite this, there is still no technical evidence that sellers have established control or that distribution is forming.
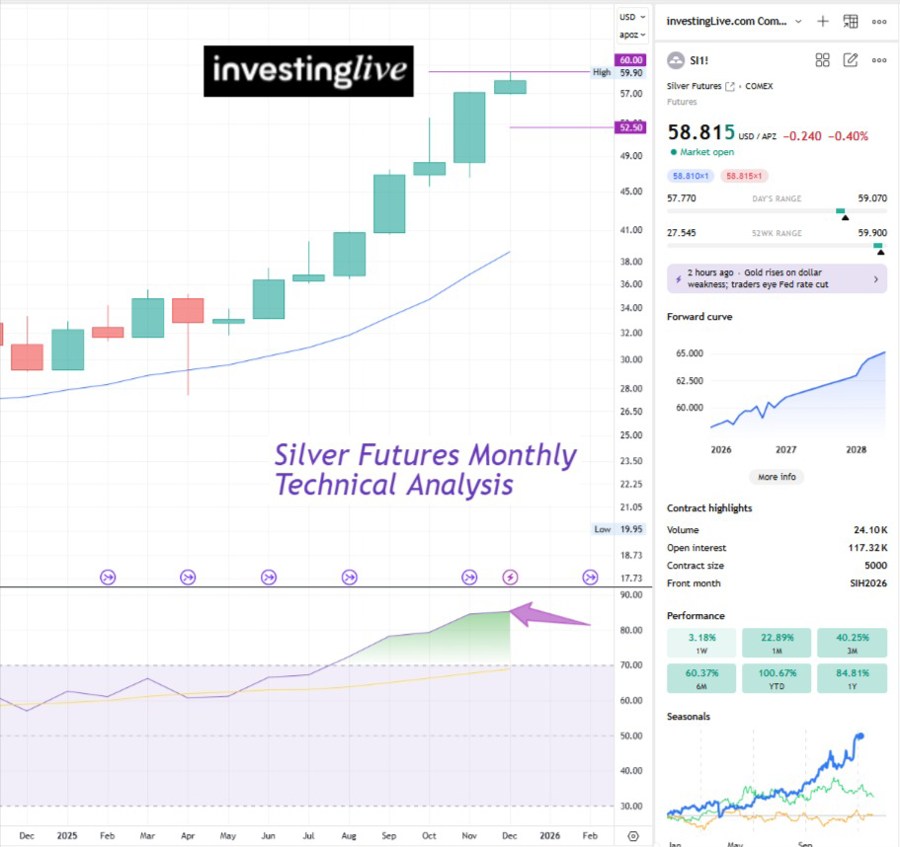
A notable feature on the monthly chart is the RSI, which sits above 85. Although this is classically overbought, traders must remember that overbought conditions in powerful trends often reflect sustained demand. Overbought readings do not imply an imminent reversal on their own, and during extended cycles, they can remain elevated for much longer than expected.
If the market chooses to cool off, a retracement into the 52.50 region would be a technically healthy development. That zone acted as resistance earlier in the year and may now serve as support. A controlled pullback into that area would likely attract fresh buyers who prefer to increase exposure on weakness rather than near a major round number such as 60.
At this stage, the monthly structure is still firmly bullish. Price action, candle structure, and momentum all point toward continuation rather than reversal.
Silver Futures Weekly Technical Analysis
The weekly chart shows a clear ascending channel that has guided Silver for several years. Price is currently moving through the upper half of this structure, suggesting a technical magnet near 77 dollars. From current levels, this represents roughly 30% of potential upside. If Silver were to correct into the 52.50 region first and then advance toward 77, the total upside from that pullback level would approach 48%.
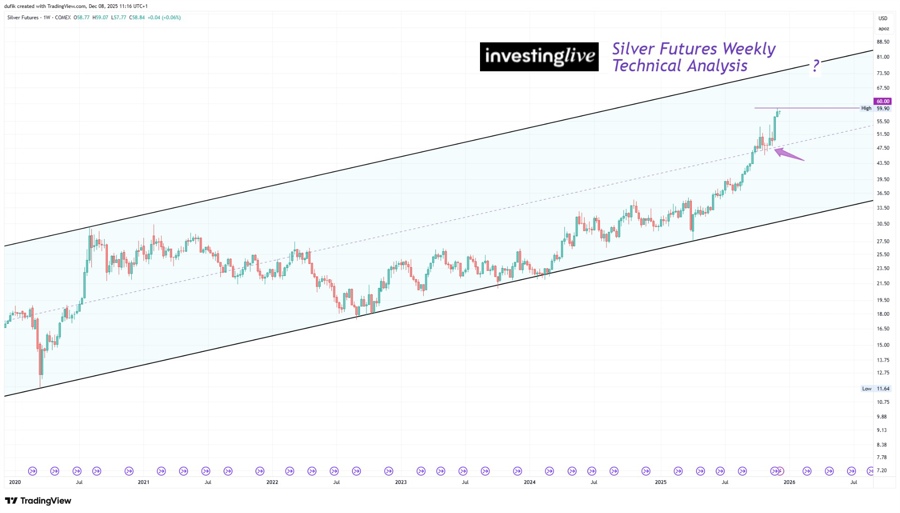
The mid channel zone, highlighted by the purple arrow, shows a brief pause where Silver consolidated before breaking higher. This is typical mid channel behavior and reinforces the idea that the current rally is following a healthy and historically consistent structure.
Although the weekly chart is strongly bullish, traders should not assume this is a perfect entry point across all timeframes. Higher timeframe strength does not remove the risk of deep short term retracements. The weekly analysis is most useful for understanding broader trend direction and long term targets. Shorter timeframe entries still require appropriate stops, position sizing, and respect for volatility.
Nevertheless, the weekly structure continues to favor the bulls and indicates room for the trend to extend further.
SLV Volatility Analysis Confirms Bullish Control
iShares Silver Trust (SLV) is the biggest silver fund in the world. When you buy SLV, you are basically buying silver, because the fund holds real silver bars in vaults in London. SLV moves almost the same as the silver spot price. If more people buy SLV, its price goes up. A valuable way to assess whether the trend is weakening behind the scenes is to compare SLV’s actual daily price changes to its implied volatility estimates. This approach helps identify when bearish pressure begins to develop consistent force.
During the past 20 trading days:
Average implied move: ±2.3%
Average actual move: ±2.1%
Days inside implied range: 13
Days outside implied range: 7
What stands out is not just the number of outliers but the directional behavior of those outliers. Silver has not produced two consecutive downside days that break implied volatility expectations. Historically, this two day sequence is one of the earliest signs that bears are gaining meaningful control.
There were isolated downside surprises on 14 November and 4 December, but in both cases the selling pressure lacked follow through. Bulls regained traction immediately afterward, signaling that the broader uptrend remains intact.
On the other hand, SLV has produced several upside days that exceeded implied volatility, including 12 November, 24 November, 26 November, and the significant move on 28 November. These upside expansions confirm that buyers still dominate the tape and that volatility based signals continue to favor the bullish trend.
For a serious trend challenge to emerge, SLV would need to show:
One more large downside break beyond implied volatility, followed by
A second consecutive or near consecutive downside day with a similar profile
Until that happens, the volatility structure supports the bullish readings seen across the monthly and weekly charts.
tradeCompass: The Key Line in the Sand for Bulls
For traders who want a clearer, rules based understanding of where trend control may shift, the tradeCompass framework on investingLive provides a valuable perspective. TradeCompass is a decision support tool that highlights key activation zones, identifies where buyers or sellers are likely to lose control, and offers a clean, structured map of important levels. It does not tell anyone what to trade. Instead, it helps traders interpret whether a trend is strengthening, weakening, or approaching an inflection point.
In the case of Silver, TradeCompass currently shows that the immediate trend remains bullish as long as price stays above 57.745. With Silver trading near 58.855, this leaves a meaningful buffer, but this particular level is designed for broader perspective, which aligns with the long term nature of this analysis.
If bears manage to close a daily candle below 57.745, that would be the first sign of a potential momentum shift. For stronger validation, traders would want to see two consecutive daily closes beneath that level. Only then would it suggest that bulls have lost control and that a deeper correction could begin. This makes the 57.745 region an important line in the sand for anyone watching where bullish confidence may finally be challenged.
TradeCompass does not replace personal judgement, but it provides structure. In a powerful trend like this, knowing where control may be lost helps traders prepare rather than react.
The Long Term Price Forecast for Silver
The combination of a strong macro backdrop, a powerful monthly trend, a well formed weekly channel, bullish volatility behavior, and supportive TradeCompass levels all point toward a continuation of Silver’s long term uptrend. A pullback to 52.50 would be healthy (and a good lead for a buy!), not bearish, and as long as that zone holds, the broader structure remains supportive of an eventual move into the 70 to 77 region. There is no technical evidence yet that the long term trend is topping.
Silver remains in a robust and compelling bullish cycle. Visit investingLive.com for additional views. Always invest and trade at your own risk only. The above silver analysis is an opinion and should be used for educational purposes only. Always do your own research.
