
FUNDAMENTAL OVERVIEW
Gold is still stuck in a tight consolidation just above the 5000 level as traders await the US NFP and CPI reports. Nothing has changed since Monday. The fundamentals are still skewed against rising prices due to improving US data (not considering the December reports) and easing geopolitical tensions.
Today, we will get the US NFP report and that’s going to be very important for gold. In fact, the market is pricing 60 bps of easing for the Fed this year, so there’s a high risk of a hawkish repricing in case the data comes out strong. In such a scenario, we will likely see gold selling off and potentially reaching new lows.
On the other hand, a weak report should strengthen the case for more Fed easing and might even see traders bringing forward rate cut bets as some Fed members expressed scepticism about labour market stabilisation. That should give gold a boost and trigger a break above the key resistance around the 5100 level.
GOLD TECHNICAL ANALYSIS – DAILY TIMEFRAME
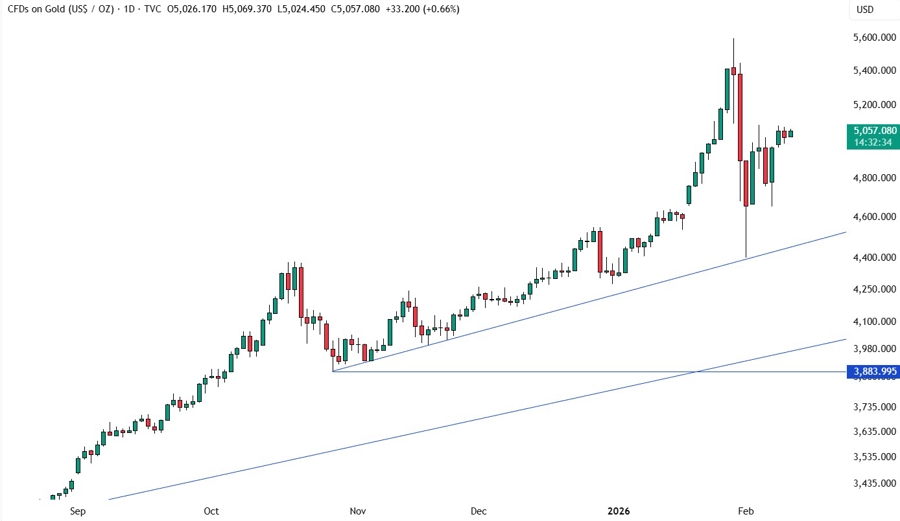
On the daily chart, we can see that gold continues to consolidate just above the 5000 level as traders await new catalysts for the next major move. If we get another selloff into the trendline, we can expect the buyers to step in with a defined risk below it to position for a rally into new all-time highs. The sellers, on the other hand, will look for a break lower to increase the bearish bets into the 4000 level next.
GOLD TECHNICAL ANALYSIS – 4 HOUR TIMEFRAME
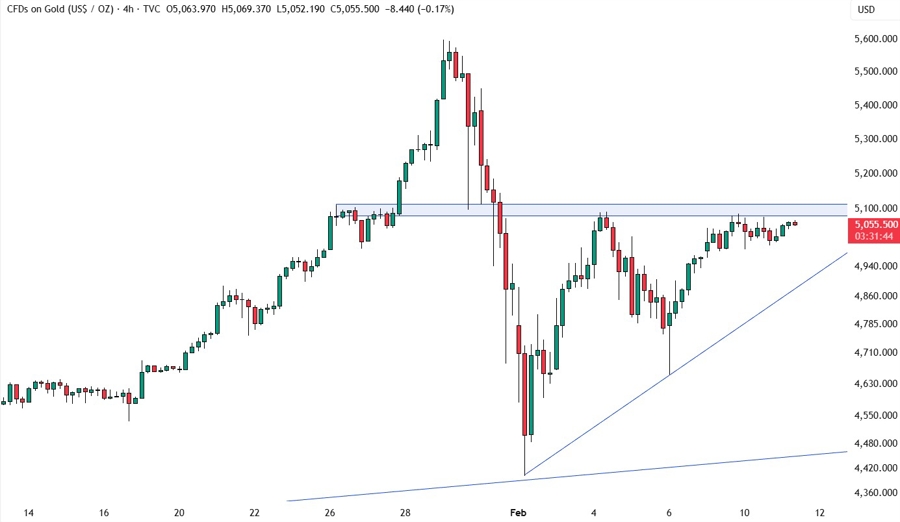
On the 4 hour chart, we can see that we have a strong resistance zone around the 5100 level. We can expect the sellers to step in around the resistance with a defined risk above it to position for a drop into the trendline targeting a breakout. The buyers, on the other hand, will look for a break higher to pile in for a rally into new all-time highs.
GOLD TECHNICAL ANALYSIS – 1 HOUR TIMEFRAME
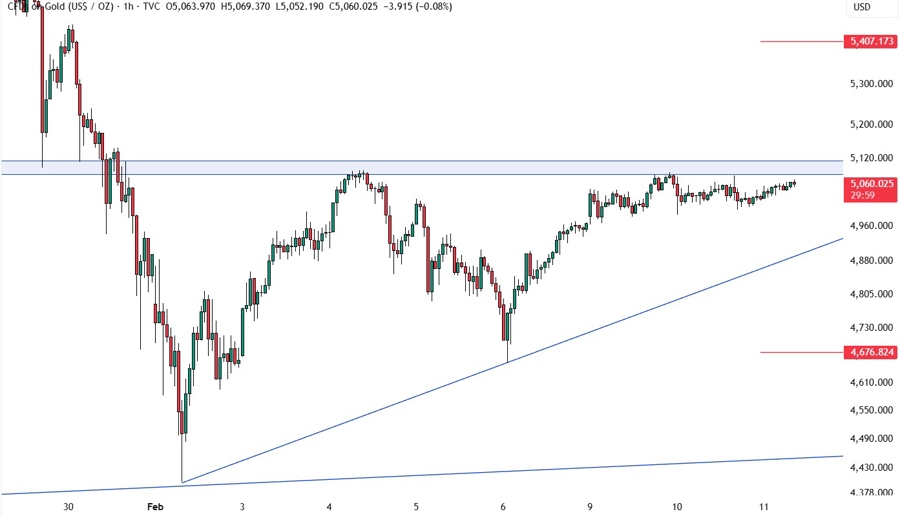
On the 1 hour chart, there’s not much else we can add here as the sellers will look for a rejection around the resistance, while the buyers will look for a break. If the price drops into the trendline, we can expect the buyers to step in there with a defined risk below the trendline targeting a break above the resistance. The sellers, on the other hand, will look for a break lower to increase the bearish bets into the next trendline. The red lines define the average daily range for today.
UPCOMING CATALYSTS
Today we have the US NFP report. Tomorrow, we get the US Jobless Claims figures. On Friday, we conclude the week with the US CPI report.


