
FUNDAMENTAL OVERVIEW
Gold got a boost on Friday after the US Supreme Court struck down Trump’s reciprocal tariffs. The initial reaction saw gold coming under pressure but eventually the market turned around, and we reached a new monthly high as Trump imposed new tariffs under a different law.
Overall, not much has changed on the tariff policy, these new developments just created some uncertainty in the short-term. USTR Greer has stated that the tariff deals remain in place and they will be honoured. Moreover, the new levies actually reduce the effective average tariff rate, so on net, it could be a positive.
The market might remain supported amid the uncertainty, but I don’t think the big picture has changed much. I would expect the gains to be pared back and the market to continue to consolidate. The real risks remain a potential US-Iran military escalation which could take gold prices to new highs or a hawkish repricing on stronger US data which would have a negative effect on the market.
GOLD TECHNICAL ANALYSIS – DAILY TIMEFRAME
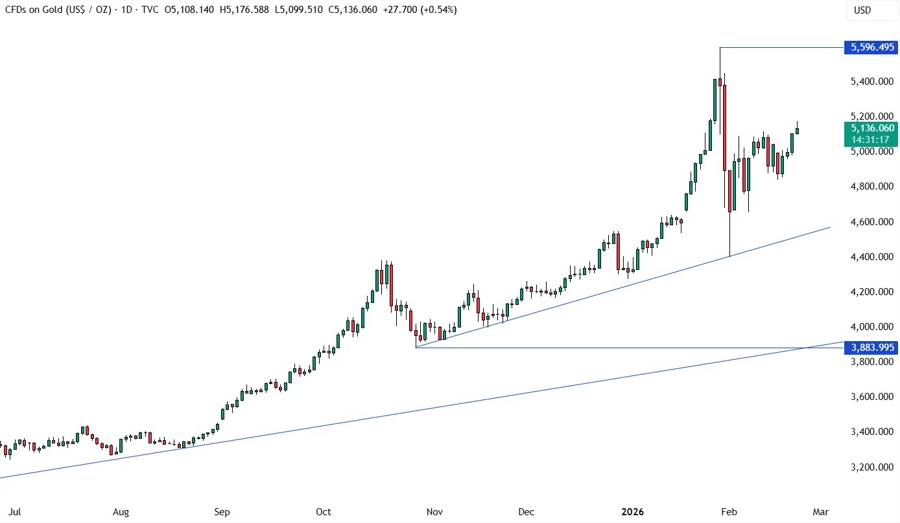
On the daily chart, we can see that gold extended into a new monthly high after the US Supreme Court struck down Trump’s reciprocal tariffs imposed on Liberation Day, and Trump re-imposed new tariffs under a different law. The price is still trading between the all-time high and the trendline, so there’s not much we can glean from this timeframe. We need to zoom in to see some more details.
GOLD TECHNICAL ANALYSIS – 4 HOUR TIMEFRAME
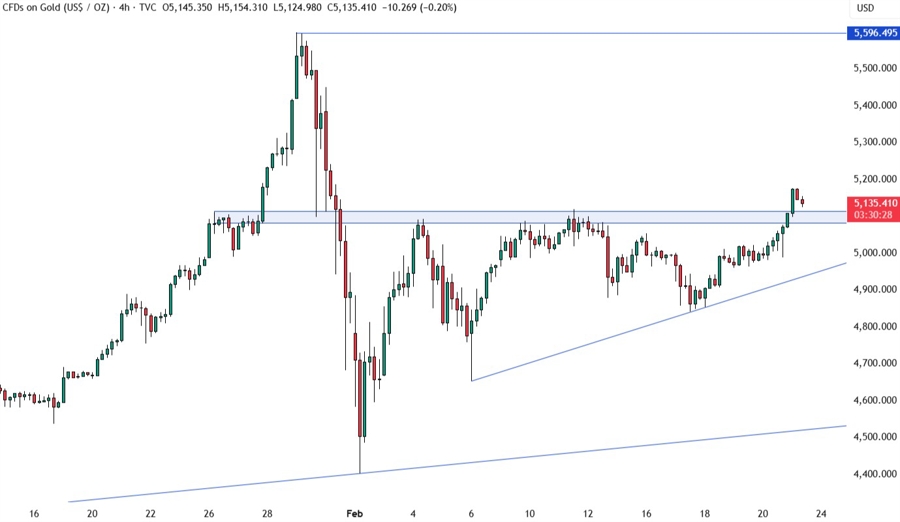
On the 4 hour chart, we can see that the price broke above the strong resistance zone around the 5100 level. If we get a retest of the resistance now turned support, we can expect the buyers to step in with a defined risk below the support to position for a rally into a new all-time high. The sellers, on the other hand, will want to see the price falling back below the support to pile back in for a drop into the major upward trendline next.
GOLD TECHNICAL ANALYSIS – 1 HOUR TIMEFRAME
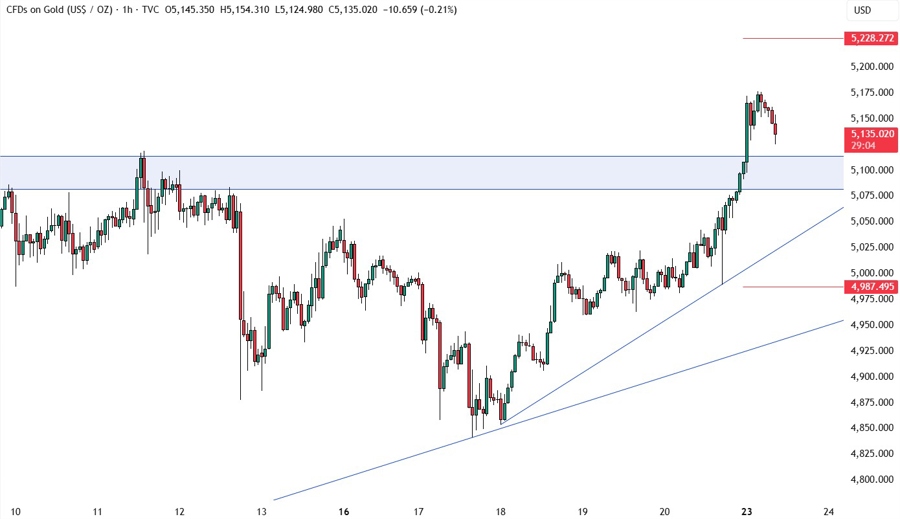
On the 1 hour chart, we can see that we have a couple of trendlines that could act as support for the buyers as long as the current bullish momentum holds. We can expect the buyers to lean on the trendlines with a defined risk below them to keep pushing into new highs, while the sellers will look for downside breaks to target new lows. The red lines define the average daily range for today.
UPCOMING CATALYSTS
Tomorrow we have the weekly US ADP jobs data. On Thursday, we get the latest US Jobless Claims figures. On Friday, we conclude the week with the US PPI report. Also, keep watching out for US-Iran headlines.


