
Many traders and investors saw the seemingly aggressive bearish reversal for gold on Friday and are wondering if we have a double top. Perhaps a start of a major bearish reversal?
Gold has been one of the most followed markets this quarter, and for two years now, actually, and many new traders are asking the same question. After several soft sessions and visible selling in early December, is gold starting a real reversal or is the market only taking a pause before deciding the next leg
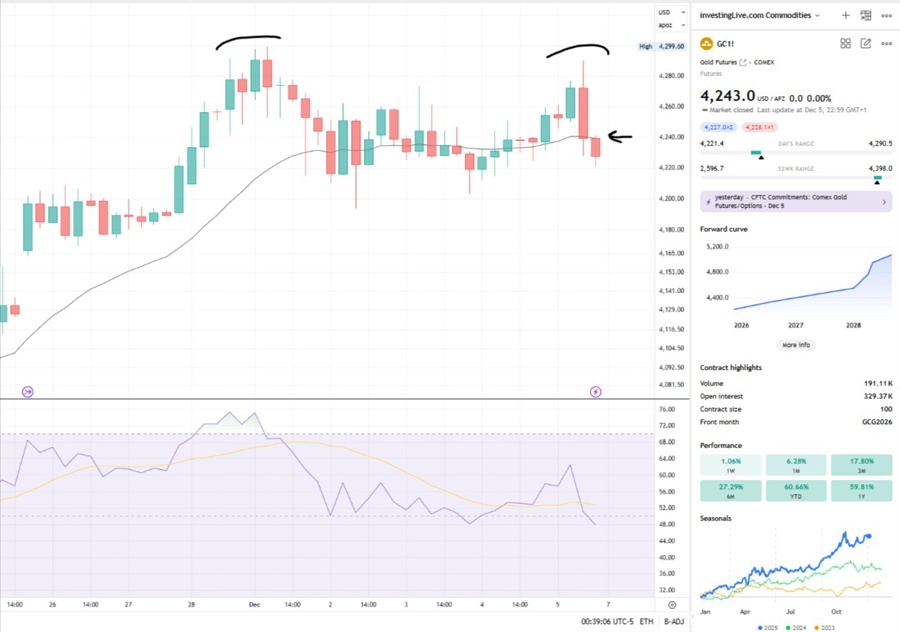
The observed pattern in Gold Futures (GC1!) is a Lower Double Top confirmed by Bearish RSI continuation (fading momentum continues) and an active test of the short-term trend line, price has crossed down the 20-period Exponential Moving Average (EMA). This confluence of signals strongly suggests an impending bearish reversal on this 4-hour chart timeframe.
However, this setup is a short-term warning, not yet a confirmation of a major trend reversal on a higher time frame. For a significant trend shift, a decisive break below on a higher timeframe is required, and crucially, this breakdown must be accompanied by meaningful trading volume (above-average volume). Without that high-volume confirmation, this pattern may only lead to a temporary pullback or consolidation before the broader, long-term trend reasserts itself. Furthermore, for a stronger sign that bears may be setting up a major bearish trend reversal (not the case yet) then we need 2 consecutive days closing below 4200 on gold futures.
Beyond the above 4hr chart, this report goes much further, investigating what is happening with gold blends three powerful forms of analysis we use at investingLive:
order flow Intel
The Commitments of Traders (COT) report
GLD implied move vs actual move
Each of these tools looks at the market from a different angle. When combined, they create a reliable decision support framework for traders who want to understand what may come next and what to look out for. This is especially helpful if you feel unsure about the recent selling pressure.
1. What order flow Intel tells us today
Many new readers may not yet know what order flow Intel is.
At investingLive we use order flow Intel as an advanced analysis methodology that reads the balance between aggressive buyers and aggressive sellers inside every futures session. It provides clarity beyond the candle chart by tracking delta, buy and sell volume, absorption zones, and whether large players are supporting or rejecting price.
Current reading: Prediction Score of -3
This signals a mild bearish bias inside what still looks like a consolidation phase.
Here is what the data shows:
Strong bullish order flow on 28 November
From 1 to 4 December, consistent net selling
From 1 December to 5 December, price drifted only about 0.9 percent lower
The selling is present, but price is not breaking down. That combination often develops in a sideways range rather than a strong trend reversal.
For new traders, the meaning is simple.
We are seeing some downside pressure, but there is no clear evidence that a major reversal has formed. For now, gold appears to be digesting recent gains.
Later in the article we will show how tradeCompass helps traders navigate this type of environment, including partial profit techniques and protection against sudden reversals.
2. What the COT report tells us about the bigger picture
The COT report, short for Commitments of Traders, is a weekly publication by the US Commodity Futures Trading Commission. It reveals how different groups of traders are positioned in the futures market.
It is especially useful for new traders because it shows how the larger, more influential players are behaving.
Here is what matters in the latest Gold COT report from 28 October 2025:
Non commercials (hedge funds and trend followers) added nearly ten thousand long contracts and cut shorts
They now hold a strong net long position
Commercials (miners and refiners) remain net short but have reduced both long and short exposure, which often happens during rollover periods
The large drop in total open interest is mostly from spread traders unwinding positions, not from bullish traders exiting the market
This is not what a major top normally looks like. At major tops, funds usually cut longs aggressively and increase short exposure. Here we see the opposite.
The medium term structure remains bullish. The market is cleaning up and rolling forward, but the core trend following group continues to support the bullish trend.
This supports the idea that any short term weakness is still happening inside a broader uptrend structure.
3. What the GLD options market tells us about risk and volatility
GLD, the SPDR Gold Shares ETF, is widely traded and provides an accessible way to track gold price dynamics.
One helpful tool for evaluating short term risk is the comparison between:
Implied move: the expected daily range priced by options
Actual move: what GLD actually did
This helps traders understand whether a move is normal or unusual.
Across the last 20 sessions:
The average implied move was about 1.3 percent
The average actual move was about 0.8 percent
Most days stayed inside the implied range
Only a few days broke outside it
Only one day showed a notable negative break (14 November)
Now focus on Friday 5 December, the day of the latest selling:
Implied move was about 0.9 percent
Actual move was only about negative 0.2 percent
GLD stayed comfortably inside the expected range
If gold were starting a major reversal, we would expect:
A larger than expected downside move
Multiple downside breaks
Expanding volatility on the way down
We are not seeing any of those signals.
The GLD options market agrees with order flow Intel and the COT report. There is selling, but not the type that usually marks the start of a large downtrend.
4. How to use this information as a new trader
The value of blending these three tools is that it allows you to understand where the pressure is coming from and how strong it truly is. The combined message of all three methods is consistent:
Gold is experiencing short term selling and downside consolidation, but there is no evidence of a major reversal at this stage.
Here is how traders can approach this environment.
Short term opportunities for gold traders and investors
order flow Intel highlights intraday levels where bounces or short term reversals may occur. These levels help you identify potential long trades even inside a slightly bearish or sideways market.
tradeCompass can guide you through how to manage these attempts.
It shows where partial profits may be taken, how to protect your entry, and where to tighten risk if the move does not follow through.
This is especially important in rangebound markets, because partial profits help reduce exposure while allowing the trade to continue if the market chooses to bounce.
Medium term opportunities for gold traders and investors
The COT report shows that the broader trend remains supported by non commercial traders. This helps new traders avoid assuming that every red day marks the start of a collapse.
Range trading awareness
Even if the range is tilting slightly downward, tradeCompass can still help you spot locations where a tactical short can be taken after a rally into resistance or supply. Partial profit rules and clear stop placement protect you from sharp upside reversals that often occur in consolidating markets.
5. Stay connected and follow the investingLive.com decision support & opportunities
If you enjoy this type of practical analysis, you are welcome to join the free investingLive Stocks Telegram channel, where we publish trade ideas during the week.
Not only for gold, but also for stocks, NASDAQ indices, commodities, and more.
Check out:
https://t.me/investingLiveStocks
You will find concise setups, early heads up alerts, and educational explanations that help you grow as a trader while staying aligned with the larger market structure.
So, what is the gold story telling us?
Across order flow Intel, the COT report, and the GLD options market, the message is consistent. Gold is showing signs of selling and consolidation, but not a major reversal. Watch for how price behaves near support and resistance, look out to the gold tradeCompass on Monday or Tuesday, with your navigational trading map for partial profits and risk control, and stay flexible while the market continues to digest recent gains.
