
FUNDAMENTAL OVERVIEW
The final two days of last week will go in the history books. Gold fell by more than 16% in just two days and extended the losses to 21% today. The risks for a correction were everywhere as the conditions didn’t justify the parabolic surge of the last two weeks. The market got so overstretched that it triggered a quick crash.
The most cited reason for the selloff was the nomination of Kevin Warsh as the next Fed chair. Analysts pointed out that he was a hawk during his last term at the Fed, but his recent speeches were all dovish. The historical stance is also never a guarantee. I’m sceptical that Warsh was really the catalyst as the underlying reasons were already pointing to lower prices.
Anyway, the last times we got such big crashes they eventually marked the tops in the bull market. This time might be different but for now the fundamentals are against higher prices. This week, the most important catalyst will be the US NFP report. We’ve been seeing improvements in the US Jobless Claims data that seem to suggest a pickup in labour market activity. A strong report would trigger a hawkish repricing in interest rate expectations and put further pressure on gold.
The other top tier data could also start to weigh on gold if they come out strong, but the NFP report should be the main event of the week. In case we don’t get the bearish catalysts, we could see a rebound in gold but we are unlikely to see new all-time highs any time soon.
GOLD TECHNICAL ANALYSIS – DAILY TIMEFRAME
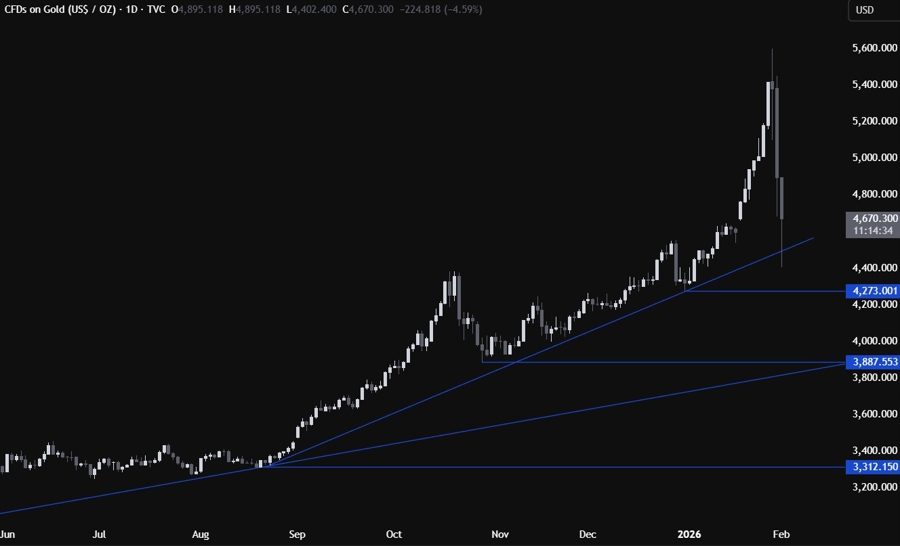
On the daily chart, we can see we had a huge crash in gold in the last two days of last week. The price bounced on the major trendline as the dip-buyers stepped in to target a new all-time highs. The sellers will want to see the price falling back below the trendline to increase the bearish bets into the 3887 level next.
GOLD TECHNICAL ANALYSIS – 4 HOUR TIMEFRAME
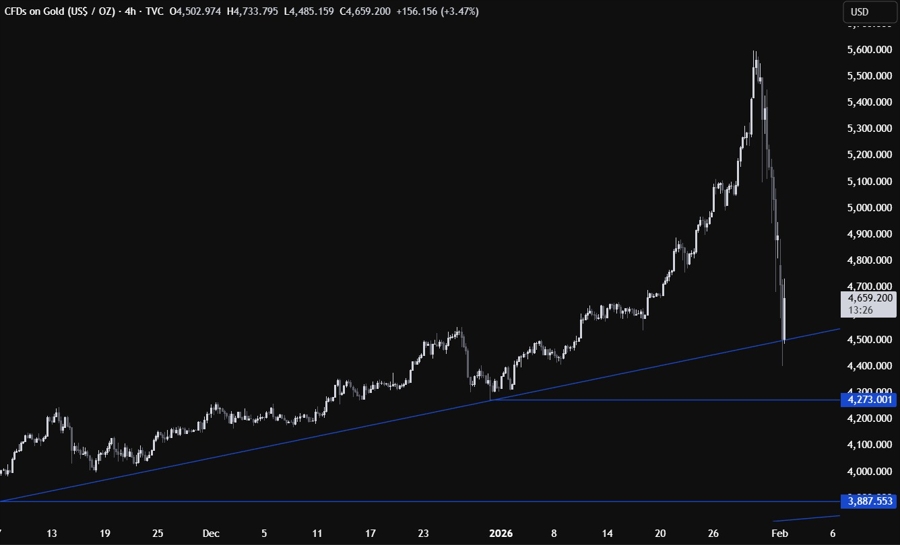
On the 4 hour chart, we can see more clearly the bounce on the trendline as the dip-buyers piled in after the huge selloff. There’s not much else we can glean from this timeframe, so we need to zoom in to see some more details.
GOLD TECHNICAL ANALYSIS – 1 HOUR TIMEFRAME
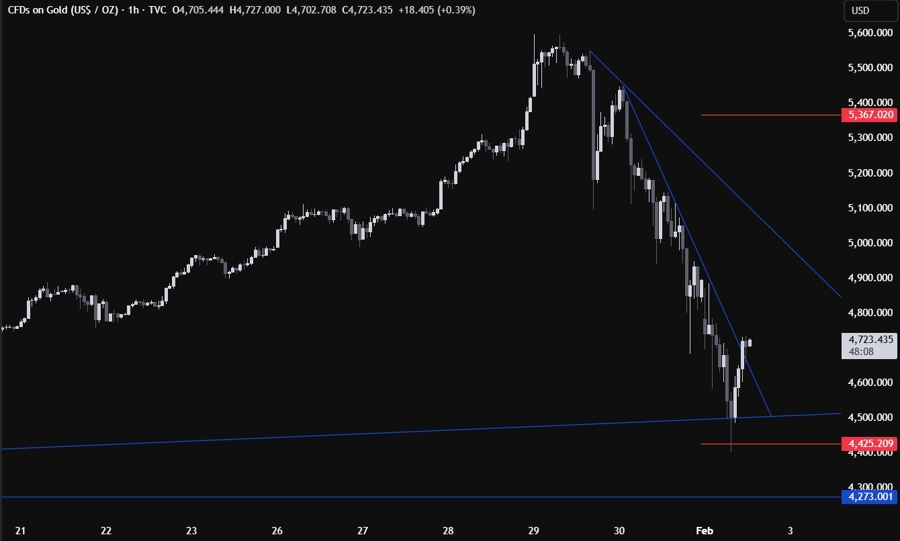
On the 1 hour chart, we can see that we had a minor downward trendline that was defining the bearish momentum. The price is now breaking higher so we can expect the buyers to increase the bullish bets into the next trendline around the 5000 level. If the price gets there, we can expect the sellers to lean on the trendline with a defined risk above it to position for a drop into new lows. The buyers, on the other hand, will look for a break higher to extend the gains into the all-time highs next. The red lines define the average daily range for today.
UPCOMING CATALYSTS
Today we have the US ISM Manufacturing PMI. Tomorrow, we get the US Job Openings data. On Wednesday, we have the US ADP and the US ISM Services PMI. On Thursday, we get the US Jobless Claims figures. On Friday, we conclude the week with the US NFP report and the University of Michigan Consumer Sentiment data.


