
FUNDAMENTAL OVERVIEW
Gold came under some pressure yesterday as Trump announced that he reached a “framework” of a deal for Greenland and that he won’t go ahead with tariffs. Moreover, we got Fed’s Cook hearing yesterday and the Supreme Court appeared likely to deny Trump's request to immediately fire her. These catalysts removed two of the strongest tailwinds of the past few days and could lead to a bigger correction in the short-term.
In the bigger picture gold remains supported amid the geopolitical tensions and the dovish Fed’s reaction function, but we are now slowly seeing a change that could reverse the trend in 2026. Looking ahead, barring another major geopolitical escalation, the Fed’s forward guidance and the US data will decide the near-term direction.
GOLD TECHNICAL ANALYSIS – DAILY TIMEFRAME
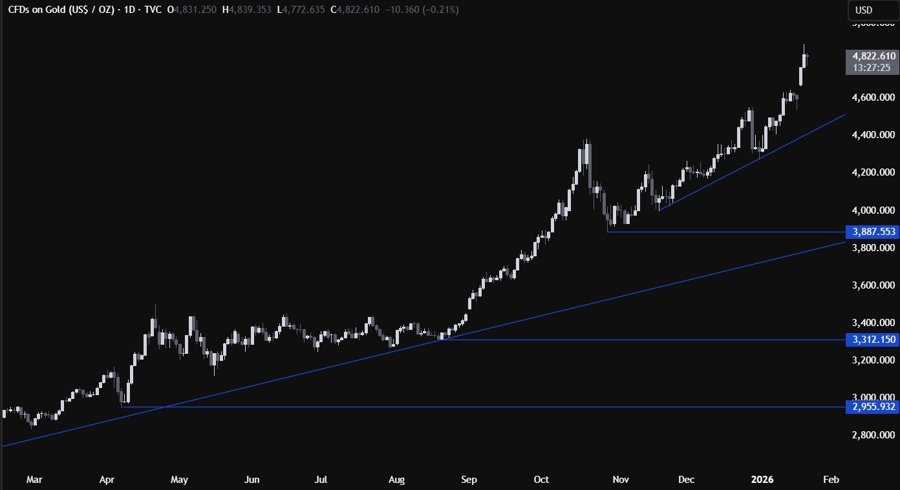
On the daily chart, we can see that Trump’s de-escalation yesterday paused the rally in gold. From a risk management perspective, the buyers will have a better risk to reward setup around the trendline to position for a rally into new record highs. The sellers, on the other hand, will want to see the price breaking lower to increase the bearish bets into the 3,887 level next. Such a big correction will likely need strong US data, but for now further upside looks unlikely.
GOLD TECHNICAL ANALYSIS – 4 HOUR TIMEFRAME
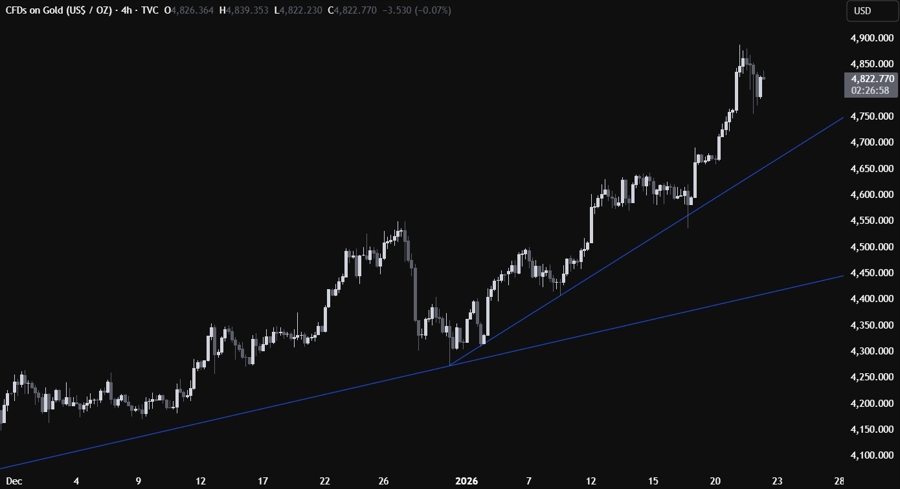
On the 4 hour chart, we can see that we have a minor upward trendline defining the bullish momentum on this timeframe. The buyers will likely continue to lean on the trendline to keep pushing into new record highs, while the sellers will need a break lower to open the door for a bigger correction into the major trendline.
GOLD TECHNICAL ANALYSIS – 1 HOUR TIMEFRAME
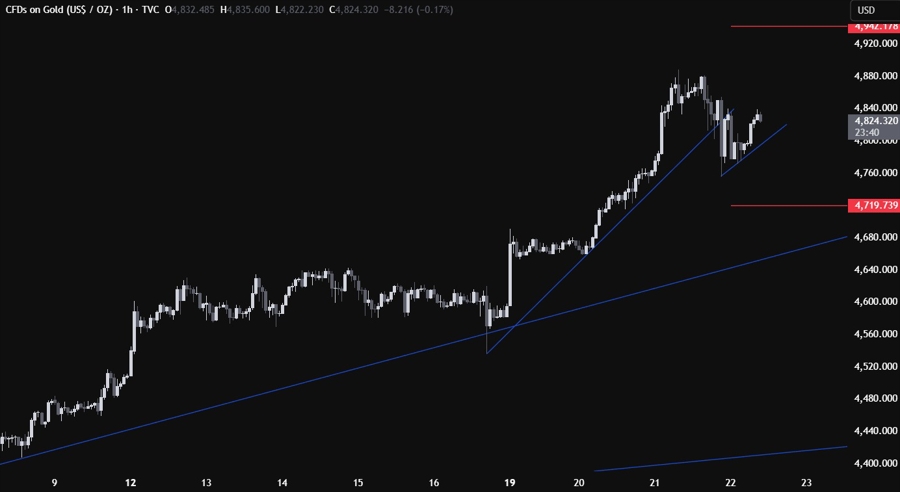
On the 1 hour chart, we can see that the price broke below the trendline that was defining the bullish momentum on this timeframe. This could suggest that we might see a bigger pullback before another push higher. We have a minor counter-trendline acting as support for now. The sellers will look for a break lower to increase the bearish bets into the next trendline. The red lines define the average daily range for today.
UPCOMING CATALYSTS
Today we get the latest US Jobless Claims figures, while tomorrow we conclude the week with the US Flash PMIs.
