
Fundamental Overview
We finally got a decent pullback in gold this week with the price falling by almost 9%. There was no catalyst for the selloff although lots of narratives have been cited just to suit the price action.
The most likely reason was just an easing in tensions on the current US-China trade front after some “positive” Trump’s comments on Friday. That’s when we got the first selloff in precious metals. Eventually, the profit-taking might have become so aggressive that momentum algos exacerbated the selloff.
Anyway, the US-China drama remains a key market focus, but traders are now more certain on some kind of a deal. The main risk event this week could be the US CPI tomorrow. Although the Fed is more focused on the labour market now, an upside surprise in inflation could still trigger a hawkish repricing in expectations.
In the bigger picture, gold should remain in an uptrend as real yields will likely continue to fall amid the Fed’s dovish reaction function. But in the short term, a hawkish repricing in interest rate expectations could trigger a correction.
Gold Technical Analysis – Daily Timeframe
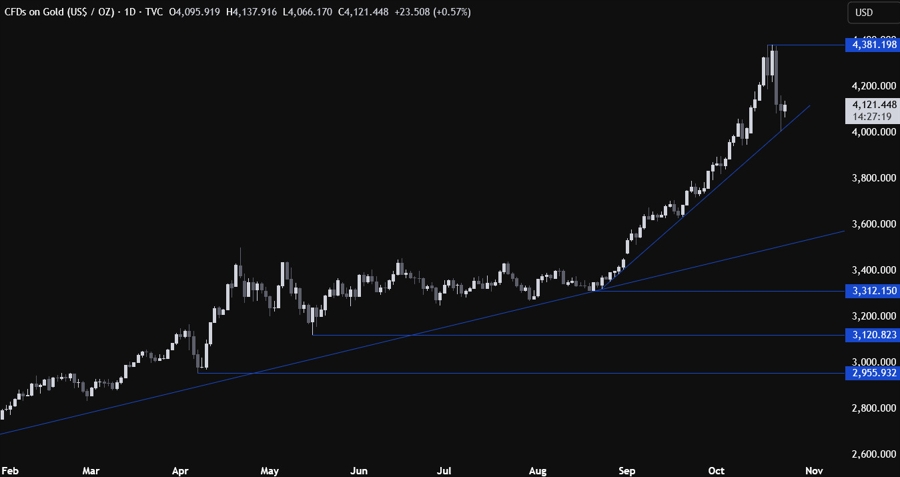
On the daily chart, we can see that gold finally pulled back and bounced around the 4,000 level where we have also a trendline acting as support. The buyers will likely continue to step in around the trendline but if we get a breakout, then we can expect the sellers to pile in to extend the pullback into the 3,600 level next.
Gold Technical Analysis – 4 hour Timeframe
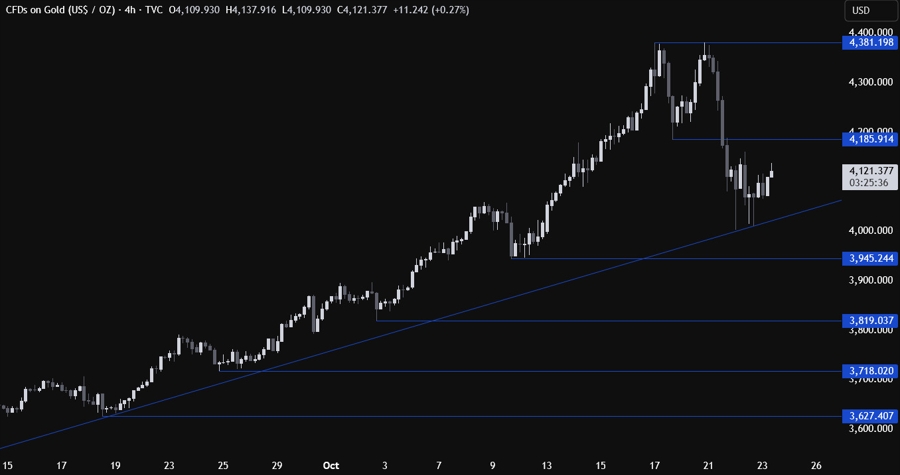
On the 4 hour chart, we can see that we broke the neckline of the double top and the bearish momentum increased as the sellers piled in more aggressively. The neckline should now act as resistance. We can expect the sellers to step in there with a defined risk above the resistance to target a break below the trendline. The buyers, on the other hand, will want to see the price breaking higher to invalidate the bearish setup and increase the bullish bets into new highs.
Gold Technical Analysis – 1 hour Timeframe
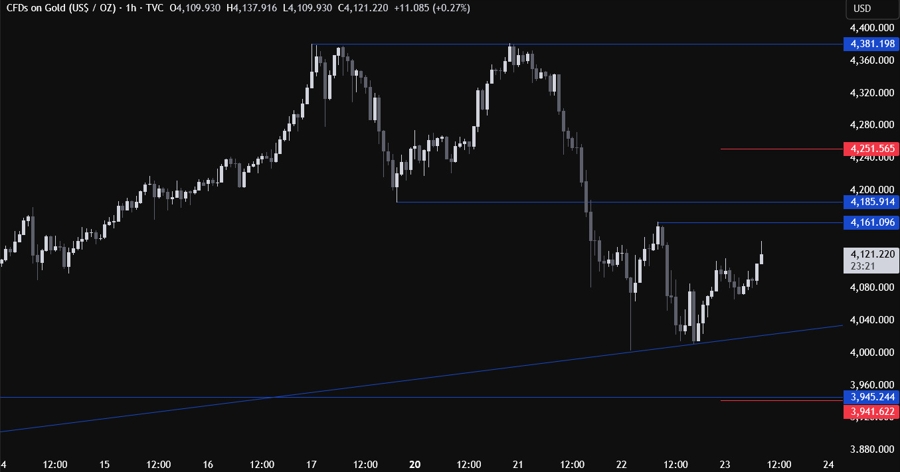
On the 1 hour chart, there’s not much else we can add here as we might just keep ranging between the 4,000 support and the 4,185 resistance. A breakout on either side though should lead to a more sustained trend. The red lines define the average daily range for today.
Upcoming Catalysts
Tomorrow we will get the US CPI report and the US flash PMIs.
