
Date: January 8, 2026 (23:23, Wednesday, 7 January 2026, Eastern Time (ET))
By investingLive.com Head of Strategy and analyst, Itai Levitan, using orderFlow Intel
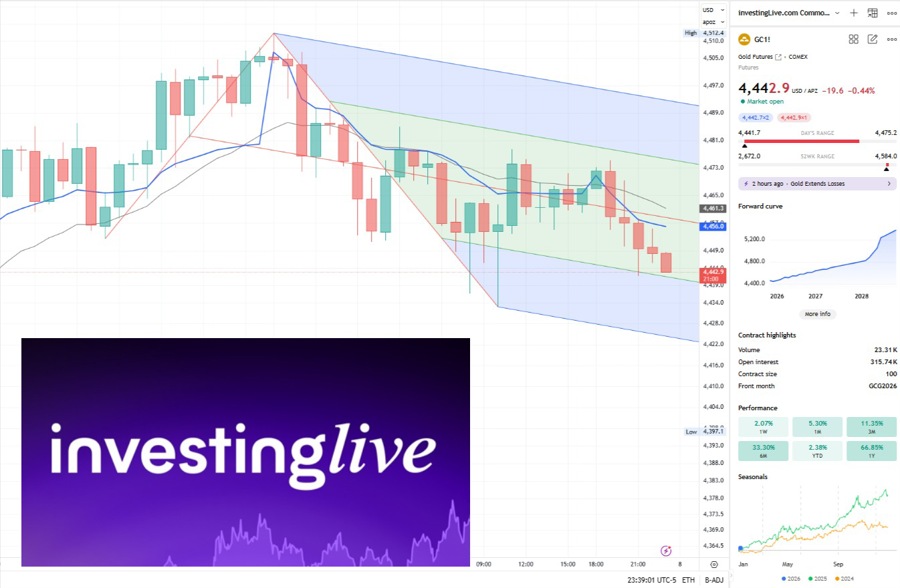
Market Focus: Gold Futures (GC), February 2026 Contract
Gold Technical Analysis Summary (Key Takeaways)
Gold technical analysis confirms a trend day down after failure above key value levels.
A clear look-above-and-fail near 4475 triggered renewed selling pressure.
Order flow shows weak downside support, suggesting consolidation is corrective, not bullish.
Gold price prediction bias remains bearish, with 4430 acting as the next downside magnet.
Gold Technical Analysis: From Consolidation to Trend Breakdown
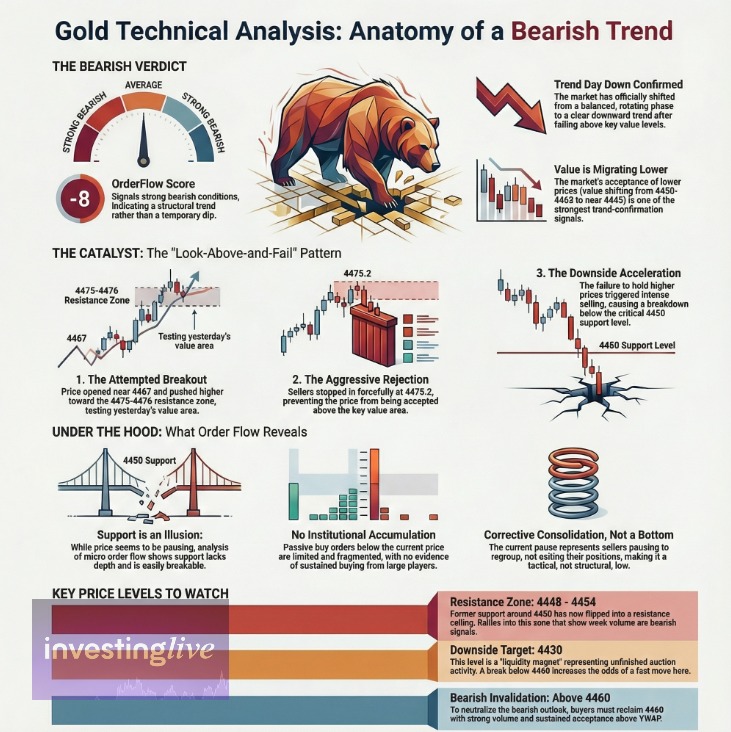
Today’s gold technical analysis shows a decisive shift in market structure. What began as an attempt to stabilize has evolved into a confirmed bearish trend. Early session strength was aggressively sold, and once price lost the 4450 support zone, downside momentum accelerated.
From a structural perspective, gold is no longer rotating within balance. Value is migrating lower, VWAP is acting as resistance, and order flow confirms sellers remain in control. Based on these factors, our OrderFlow Score stands at -8, signaling strong bearish conditions rather than a temporary dip.
Gold Price Action Breakdown: The Look Above and Fail Pattern
Understanding the morning sequence is critical for gold price prediction today.
Opening context: Gold opened near 4467 and pushed higher toward 4475-4476, aligning with yesterday’s Value Area High.
Rejection: Sellers stepped in aggressively at 4475.2, preventing acceptance above value.
Result: Once price failed above value, selling intensified and gold broke below 4450, confirming a bearish continuation pattern.
This type of look-above-and-fail is a classic technical signal that often precedes range expansion to the downside.
Order Flow Insight for Gold: Thin Support at the Lows
Gold is currently pausing between 4440 and 4448, which may appear constructive on higher timeframes. However, deeper order flow analysis paints a different picture.
Weak Support Structure
Passive buy orders below current price are limited and fragmented.
There is no evidence of sustained institutional accumulation.
This type of price behavior typically represents corrective consolidation, not a bottoming process. Sellers are pausing, not exiting.
Value Area Migration Confirms Bearish Bias
Previous value: 4450 to 4465
Developing value today: Centered closer to 4445
When value shifts lower, it confirms that the market is accepting lower prices. In gold technical analysis, value migration is one of the strongest trend-confirmation signals.
Gold Price Prediction: Bearish Bias Remains Intact
OrderFlow Score: -8 (Strong Bearish)
Market Condition: Trend continuation
Major supports including 4450 and VWAP have failed.
Upside attempts lack volume expansion and delta confirmation.
The pause at current lows appears tactical, not structural.
Unless proven otherwise, the technical evidence favors additional downside.
Key Gold Technical Levels to Watch for Today
Resistance Zone: 4448 to 4454
Former support at 4450 has flipped into resistance.
Gold price prediction scenario: If price revisits this area with weak momentum or stalling volume, it reinforces bearish continuation setups.
Downside Target: 4430
This level represents unfinished auction activity and remains a liquidity magnet.
A clean break below 4440 increases the probability of a fast move toward 4430.
Bearish Invalidation Level: Above 4460
To neutralize the bearish gold technical outlook, bulls must reclaim 4460 with strong volume and sustained acceptance above VWAP.
Until that occurs, rallies are technically corrective.
Educational Insight: Identifying Real Support in Gold Technical Analysis
A common challenge in gold technical analysis is distinguishing real support from perceived support.
On higher timeframes, volume clusters can look like accumulation.
On lower timeframes, those same areas may reveal thin, easily breakable bids.
This is why professional gold price prediction relies on multi-timeframe confirmation. Today’s micro order flow confirms that current support lacks depth, increasing the odds of another downside leg.
Gold Chart of the Day (so far... stay tuned for more at our Telegram Channel)
Disclaimer: This gold technical analysis and gold price prediction are for educational purposes only and do not constitute financial advice. Futures trading involves substantial risk and may not be suitable for all traders.
Join us on Telegram for free, at https://t.me/investingLiveStocks, where we dish out further updates, ideas, opinions, and gold gems.
We had a short taken yesterday near the highs of today, and exited and took the last profit target just above 4430. Come on over to the Telegram Channel to see possible future trade ideas live (and we never promise they will succeed, we just promise to work hard and wisely).
orderFlow Intel Update, 04:41 Thursday, 8 January 2026 Eastern Time (ET)
Gold Futures (GC): Dip Buyers Step In, Breakout Still Needs Proof
Gold futures are showing an improving short-term structure, but the bigger picture remains unresolved. The latest 50-range order flow reveals a successful defense of the 4436 area, suggesting dip buyers are active again. At the same time, higher prices continue to face known selling pressure near 4445, keeping this market in a decision zone.
What changed
After a sell-off from the 4445 area, price pulled back in a controlled way. The retracement toward ~4436 occurred on light volume, followed by a clear positive response from buyers. Order flow showed a strong “at-the-low” reaction, confirming that buyers were waiting in that zone rather than chasing higher prices. This creates a higher low relative to the prior base near ~4428.
Why this matters
A defended pullback with positive order flow often marks constructive consolidation. In simple terms, sellers failed to press the market lower, while buyers showed willingness to step in earlier than before. This raises the odds of another push higher, but it does not guarantee a breakout.
Key levels to watch
4436: Short-term floor. As long as price holds above this area, the bullish attempt stays alive.
4442: Near-term trigger. Sustained trade above here increases pressure on shorts.
4445: Major test. This level has already attracted sellers. Acceptance above it is required to confirm upside continuation.
4450: Upside magnet if 4445 breaks and holds.
4430: Bearish re-entry zone. A failure back below 4435 would likely reopen a move toward this area.
Bias and guidance
Primary bias right now: Slightly bullish, tactical only.
This is a buy-the-dip attempt, not a confirmed trend reversal.
Bulls need follow-through and acceptance above 4445.
Bears regain control if price loses 4435 with expanding negative pressure.
Bottom line: The dip to 4436 was bought, and structure improved on the lower timeframe. However, Gold still needs to prove it can absorb sellers near 4445. Until that happens, expect two-sided trade and be disciplined with levels and risk.
orderFlow Intel Update, 07:17 Thursday, 8 January 2026 Eastern Time (ET)
TRADER UPDATE – Gold Futures (GC): Dip-Buy Attempt Failed, Sellers Regain Control Below $4,436
Gold futures just delivered the key answer: the earlier dip-buy response near $4,436 did not convert into acceptance. The market rolled over again, and the latest order flow confirms that sellers are back in control. What looked like constructive consolidation has shifted back into a sell-the-rally environment, with price now accepting lower levels inside the range.
What changed from the prior read
In the earlier sequence, buyers briefly defended a pullback and attempted to build a higher-low structure. That was the bullish premise. The follow-through never arrived. Instead, price slipped back below that floor and the tape started printing larger, more persistent negative delta, signaling that sellers were no longer just reacting at highs - they were pressing bids with intent.
Order flow tells the story
When bearish continuation is real, you typically see two things:
Negative delta expands across multiple rotations, not just one red candle.
Former support stops acting like a floor and begins behaving like overhead supply.
That is what developed here. Selling pressure built progressively, and the market began accepting prices below the prior defense zone, which is a meaningful shift in control.
Key levels for decision support
$4,436 to $4,440: Former floor, now a key resistance band. If price rallies into this zone and order flow stays weak, it favors another sell response.
$4,430: First downside checkpoint. If sellers stay aggressive below it, the door opens for continuation.
$4,425 to $4,421: Next likely acceptance area where price may pause or attempt a bounce.
$4,418: Deeper magnet if selling accelerates and the market fails to stabilize above $4,421.
$4,445: Bullish reclaim level. Sustained trade back above this area would challenge the bearish premise and force reassessment.
Primary bias right now
Bearish. The market has reverted to distribution behavior: rallies are vulnerable, and downside continuation remains the higher-probability path unless buyers can reclaim resistance with convincing follow-through.
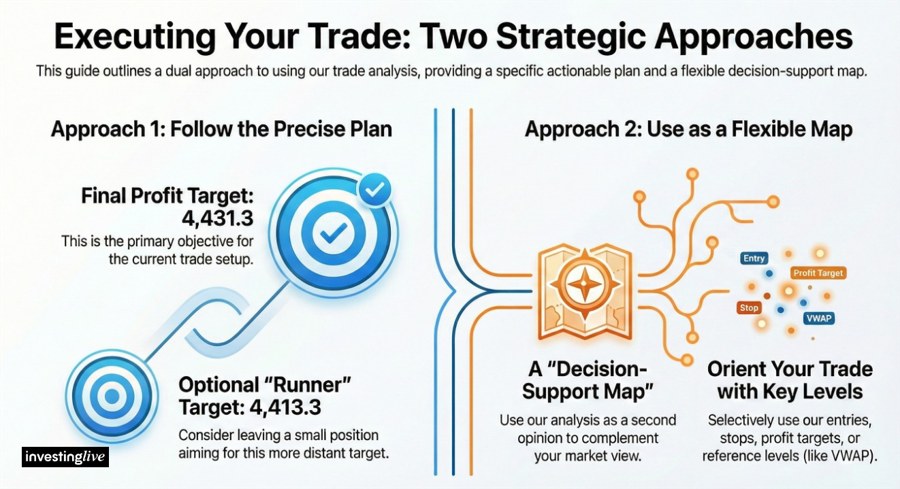
How to use this update as a map
Think of these levels as a compass, not a command. If price pushes into $4,436 to $4,440 but cannot hold above it, that failure is often where short setups gain traction. If price breaks below $4,430 and stays heavy on the tape, it typically signals a deeper bearish phase toward $4,425-$4,421 and potentially $4,418. On the flip side, if buyers regain control and sustain above $4,445, the bearish thesis is weakened.
Trade at your own risk. This is decision support, not financial advice.
=================================
TRADER UPDATE – Gold Futures (GC): Target Hit at 4471–4472, Trend Strong but Stretch Risk Rising, 11:59 Thursday, 8 January 2026 Eastern Time (ET)
Gold futures have delivered exactly what the order flow was pointing toward earlier today: a clean continuation move into a major naked level around 4471–4472. The rally from the 4430 area has been powerful and orderly, confirming a bullish regime shift from the earlier range and squeeze phase. That said, price is now at a destination, not an early entry.
What just happened
The market transitioned from mean reversion into imbalance, accelerating higher after reclaiming VWAP.
Price has now reached a Virgin POC / naked high-volume node near 4471–4472, which often acts as a liquidity magnet.
On the 30-minute chart, price has been walking the upper band (+2 standard deviations), a classic sign of trend strength but also statistical stretch.
The volume profile has taken on a P-shape, typical of short covering and late-stage continuation.
This confirms strength, but also signals that the easy directional move is likely behind us.
Why caution matters here
Price is now well separated from VWAP (~4448). That gap typically closes over time, either via pullback or sideways consolidation.
Buying directly into a +2 standard deviation extension at a naked level is historically low reward / high risk.
Naked levels tend to lose their “magnetic pull” once tagged, often leading to a reaction rather than immediate continuation.
Key levels to watch for gold futures
4471–4472: Current decision zone (naked level). Expect reactions.
4474–4476: Stretch / climax area. A spike and failure here would favor a pullback.
4460–4462: First logical pullback and support zone (mid-channel).
4448–4450 (VWAP): Structural support. Holding above keeps the bullish regime intact.
Bias and guidance
Trend bias: Bullish.
Right-now opportunity: Caution. This is a harvest zone, not a chase zone.
How to use this as a map:
If price accepts above 4472 with volume, continuation toward higher references is possible.
If price fails to hold 4472, expect a rotation back toward 4460–4462 to reset the trend.
Longs from lower levels should consider taking profits or tightening risk.
New longs here carry poor risk/reward unless acceptance is clearly proven.
Bottom line
Gold has done its job by reaching the naked 4471–4472 level. The trend is still up, but price is now extended and statistically stretched. From here, expect consolidation or a pullback unless fresh initiative buying appears. Staying disciplined and patient at these levels matters more than predicting the next few ticks.
Trade at your own risk. This is decision support, not financial advice.


