
Fundamental Overview
Gold continues to consolidate near key levels as the uncertainty around the December rate cut remains high. Fundamentally, nothing has changed as the only US official data we will get before the FOMC meeting is from September, which is old news by now.
Nonetheless, we have the US jobless claims as the timeliest indicator of the labour market conditions, and it’s been pointing to the same gradual cooling we’ve been seeing throughout the year with low hiring and low firing.
One important development we got recently is Fed’s Williams delivering dovish comments on Friday where he suggested that he would support a rate cut in December. The December rate cut odds jumped to 60% and gave gold a boost, although eventually the gains faded.
In the bigger picture, gold should remain in an uptrend as real yields will likely continue to fall amid the Fed’s dovish reaction function. But in the short term, a further hawkish repricing in interest rate expectations should keep weighing on the market.
Gold Technical Analysis – Daily Timeframe
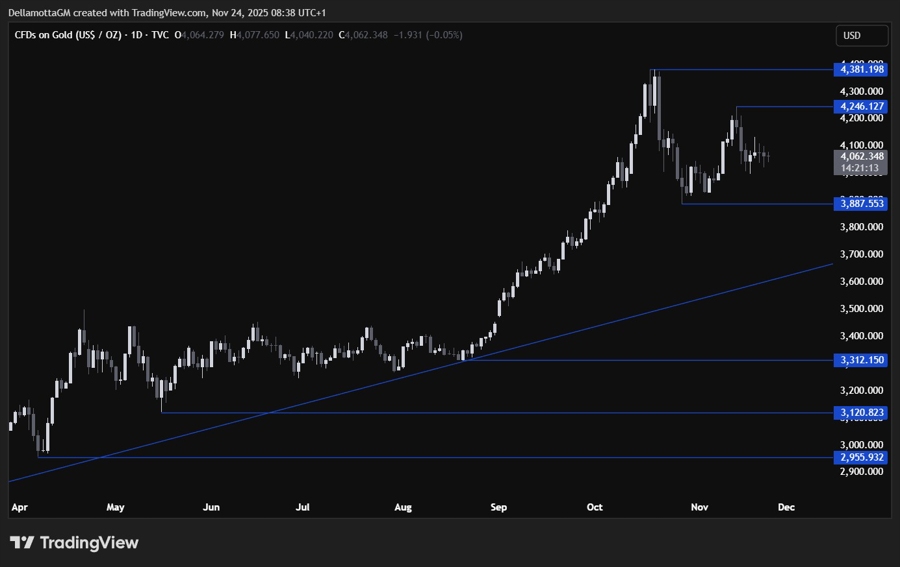
On the daily chart, we can see that gold is consolidating just above the 4000 level as traders await new catalysts to push into either direction. There’s not much we can glean from this timeframe, so we need to zoom in to see some more details.
Gold Technical Analysis – 4 hour Timeframe
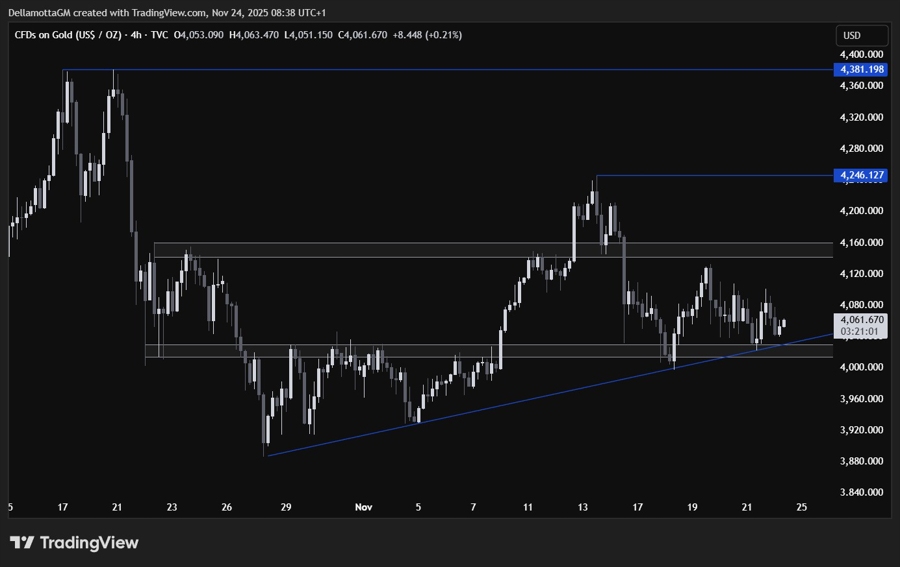
On the 4 hour chart, we can see that we have a strong support zone around the 4,020 level where we have also the upward trendline for confluence. This is where we can expect the buyers to step in with a defined risk below the support to position for a rally into the 4150 resistance. The sellers, on the other hand, will want to see the price breaking lower to increase the bearish bets into new lows.
Gold Technical Analysis – 1 hour Timeframe
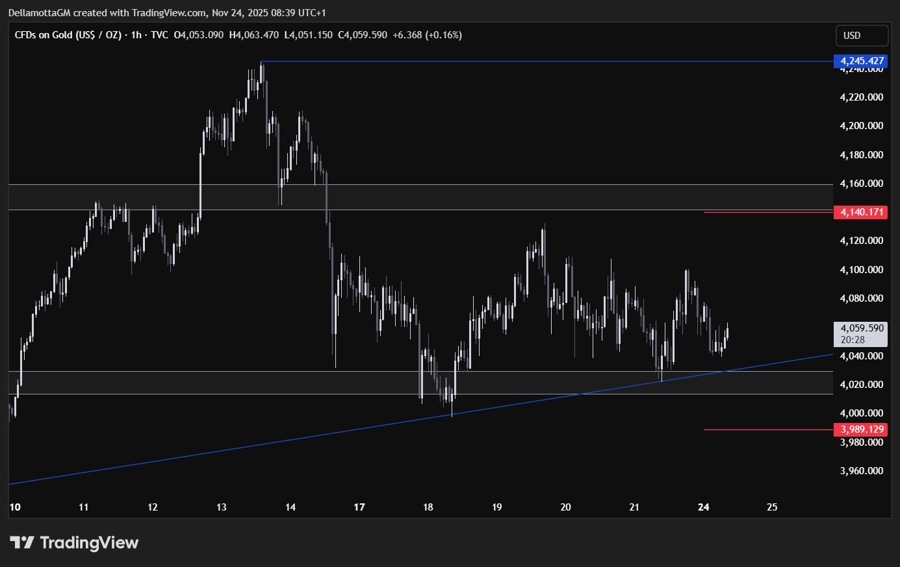
On the 1 hour chart, there’s not much else we can add here as we’ve just been having a rangebound price action. Again, the buyers will likely step in around the support to target the resistance, while the sellers will look for a break lower. The red lines define the average daily range for today.
Upcoming Catalysts
Tomorrow we get the weekly ADP jobs data and the US Consumer Confidence report. We will also get the September US PPI and Retail Sales reports. On Wednesday, we get the most recent US Jobless Claims figures and the September Durable Goods Orders report. On Thursday, we have the US Thanksgiving holiday, so the final part of the week will likely see a rangebound market.
