
Fundamental Overview
Gold eventually extended the losses as the preliminary US-China deal reached over the weekend weighed on the market as traders positioned into a positive Trump-Xi meeting. In the short-term, there are no strong reasons to pile into longs at the moment, so we might create another range around the 4,000 level.
Nonetheless, there are still bearish risks ahead. The first one is today as we have the FOMC policy decision. The Fed is expected to cut interest rates by 25 bps and signal an end to QT. The focus will likely be on Fed Chair Powell. If he sounds even a bit uncertain on a rate cut in December, then the market will likely take that as a hawkish surprise and gold should drop to new lows. Conversely, if he keeps the status quo, then it would be seen as neutral or slightly positive for gold.
In the bigger picture, gold should remain in an uptrend as real yields will likely continue to fall amid the Fed’s dovish reaction function. But in the short term, a hawkish repricing in interest rate expectations could keep weighing on the market.
Gold Technical Analysis – Daily Timeframe
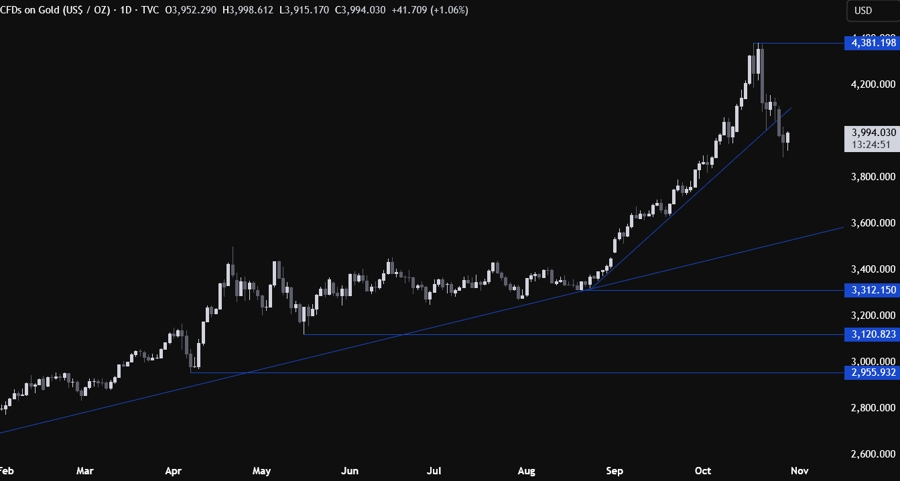
On the daily chart, we can see that gold eventually broke below the trendline and extend the losses as the sellers increased the bearish bets into new lows. The breakout opened the door for a move into the major trendline around the 3,600 level but we might need a less dovish Fed or strong US data to get there.
If we get there, we can expect the buyers to lean on the trendline with a defined risk below it to position for a rally into a new all-time high. The sellers, on the other hand, will look for a break lower to extend the drop into the 3,300 level next.
Gold Technical Analysis – 4 hour Timeframe
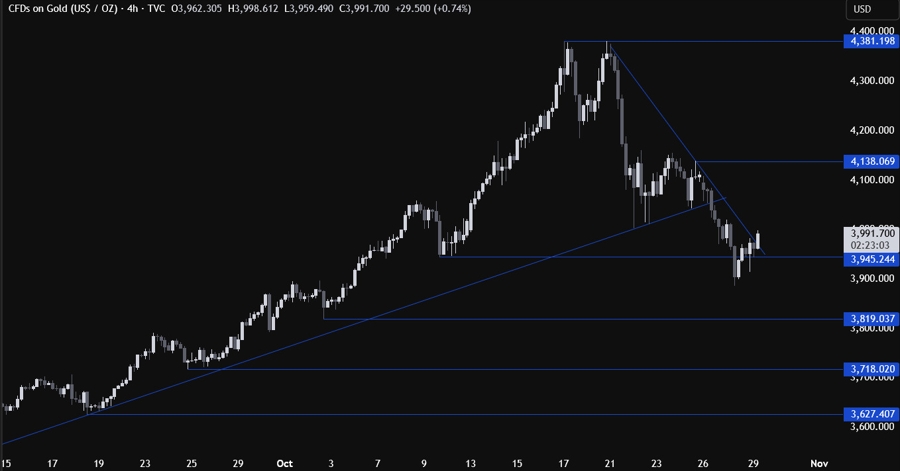
On the 4 hour chart, we can see that we are breaking above a downward trendline, which could be a signal of a change in the short-term momentum and open the door for a pullback into the 4,138 level. The buyers will likely pile in around these levels with a defined risk below the 3,945 level to position for a rally into the 4,138 level.
The sellers, on the other hand, will want to see the price falling back below the trendline and the 4,138 level to leave behind a fakeout and increase the bearish bets into the 3,819 level next.
Gold Technical Analysis – 1 hour Timeframe
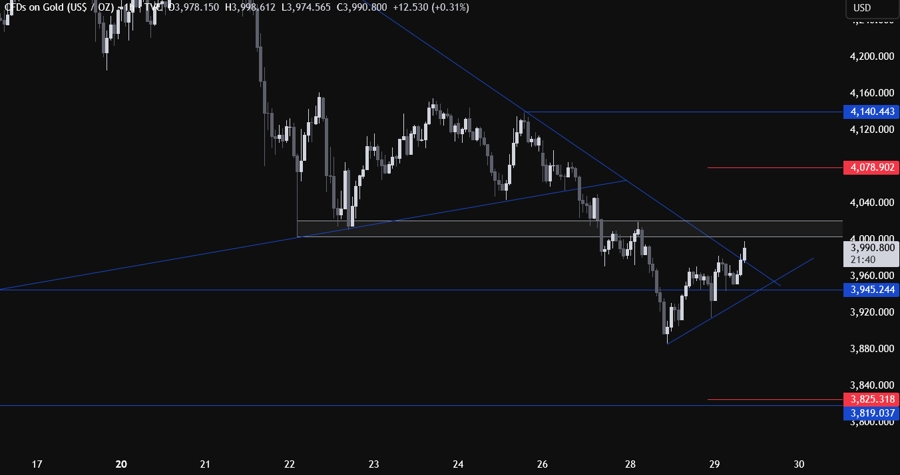
On the 1 hour chart, we can see that we have a minor resistance zone around the 4,000 and 4,020 level. This is where we can expect the sellers to step in with a defined risk above the resistance to position for a drop into new lows. The buyers, on the other hand, will look for a break higher to increase the bullish bets into the 4,138 level next.
Moreover, we can see that we have a minor upward trendline defining the current pullback. If the price pulls back into the trendline, we can expect the buyers to lean on it with a defined risk below it to keep pushing into new highs, while the sellers will look for a break lower to increase the bearish bets into the 3,819 level next. The red lines define the average daily range for today.
Upcoming Catalysts
Today we have the FOMC policy decision, while tomorrow we have the Trump-Xi meeting.
