
Fundamental Overview
Gold has been keeping a bullish bias ever since Fed’s Williams endorsed a rate cut at the December FOMC meeting. The higher rate cut odds have been a tailwind for precious metals.
There’s been nothing in the meantime to stop this momentum as the recent US data came in on the softer side. It’s all about the Fed’s forward guidance now and the following NFP and CPI reports. Hawkish stuff should weigh on gold and trigger another correction, while a dovish leaning should keep supporting the upside.
In the bigger picture, gold should remain in an uptrend as real yields will likely continue to fall amid the Fed’s dovish reaction function. But in the short term, a further hawkish repricing in interest rate expectations should weigh on the market.
Gold Technical Analysis – Daily Timeframe
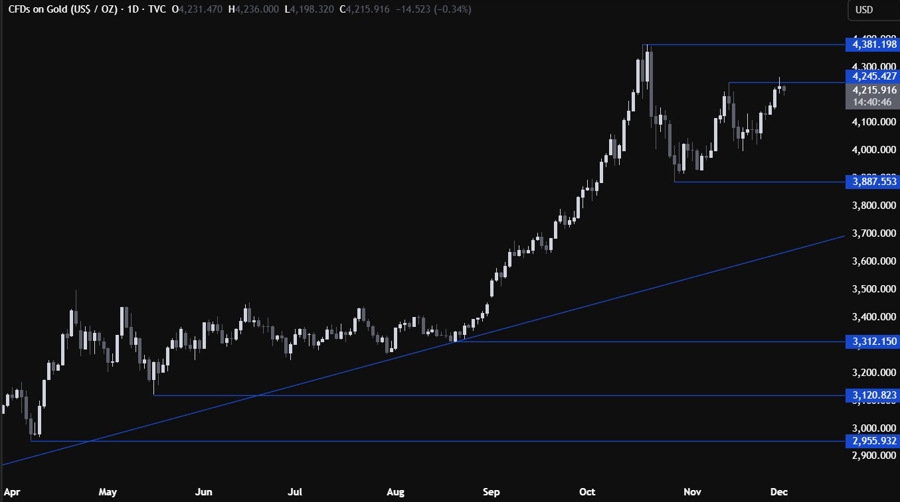
On the daily chart, we can see that gold couldn’t sustain the break above the 4245 level and pulled back a bit. This is where we can expect the sellers to step in with a defined risk above the recent high to position for a drop into the 4000 level. The buyers, on the other hand, will want to see the price breaking higher to extend the rally into the all-time highs.
Gold Technical Analysis – 4 hour Timeframe
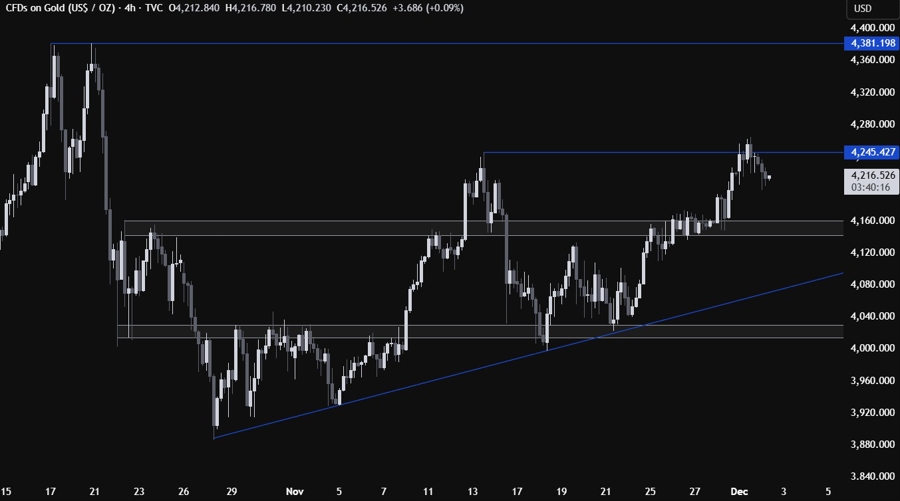
On the 4 hour chart, we can see that we have a strong support zone around the 4150 level. If the price gets there, we can expect the buyers to step in with a defined risk below the support to position for a rally into a new all-time high. The sellers, on the other hand, will look for a break lower to increase the bearish bets into the trendline.
Gold Technical Analysis – 1 hour Timeframe
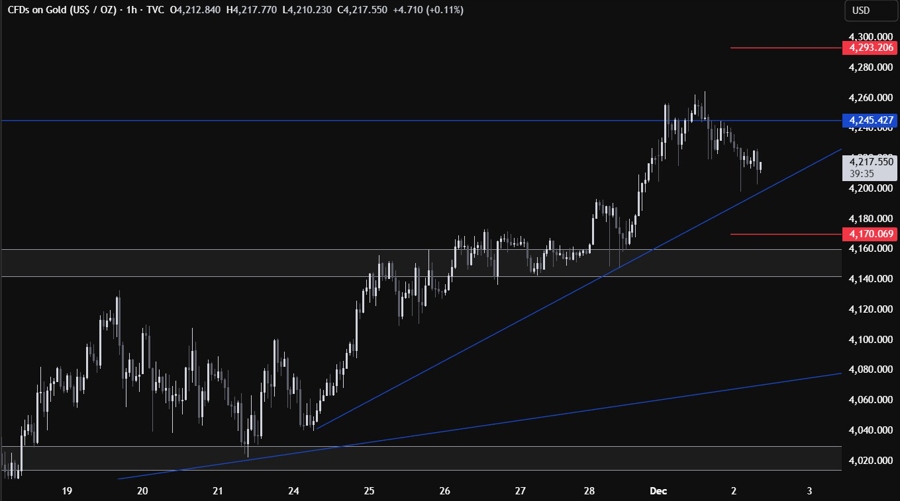
On the 1 hour chart, we can see that we have another minor trendline defining the bullish momentum on this timeframe. The buyers will likely continue to step in around the trendline with a defined risk below it to keep pushing into new highs, while the sellers will look for a break lower to extend the drop into the 4150 support zone. The red lines define the average daily range for today.
Upcoming Catalysts
Tomorrow we have the US ADP and the US ISM Services PMI. On Thursday, we get the latest US Jobless Claims figures. On Friday, we conclude the week with the University of Michigan Consumer Sentiment report.
