
Fundamental Overview
Gold broke above another key resistance yesterday extending the gains above the 4,200 level. There’s nothing fundamental driving the price action as a short squeeze looks like the most reasonable culprit.
We had soft weekly ADP data on Tuesday but if that was the reason, we would have seen a stronger reaction already on Tuesday not the day after.
The reopening of the US government will bring back the key US data like the NFP and CPI, and those will be key risk events for gold.
Strong US data, especially on the labour market side, should keep weighing on gold as it would keep the market speculating on rate cuts pause. Conversely, weak data is likely to support the precious metal as it would give the Fed more reasons to keep cutting rates.
In the bigger picture, gold should remain in an uptrend as real yields will likely continue to fall amid the Fed’s dovish reaction function. But in the short term, a further hawkish repricing in interest rate expectations should keep weighing on the market.
Gold Technical Analysis – Daily Timeframe
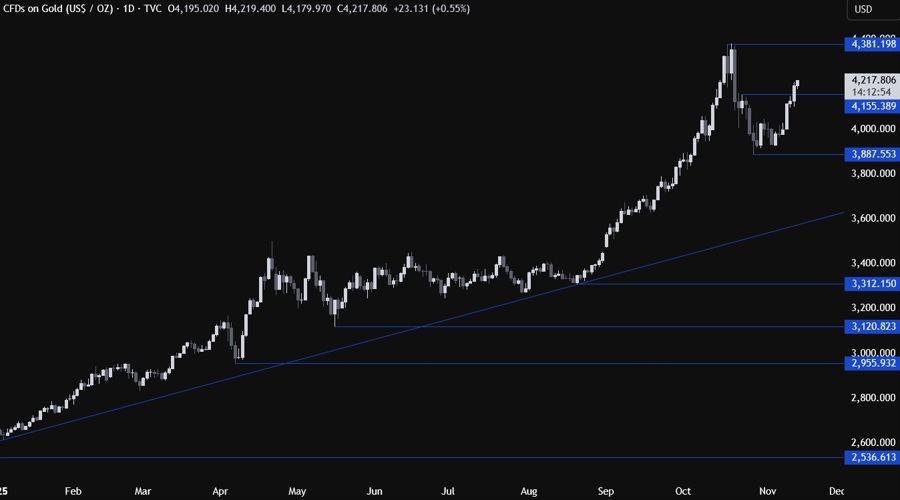
On the daily chart, we can see that gold broke above the most recent swing high around the 4,150 level and extended the gains above the 4,200 level as the buyers increased the bullish bets into a new all-time high. There’s not much here for the sellers as they should either short from the all-time highs or wait for the price to fall back below the 4,150 level to pile in for new lows.
Gold Technical Analysis – 4 hour Timeframe
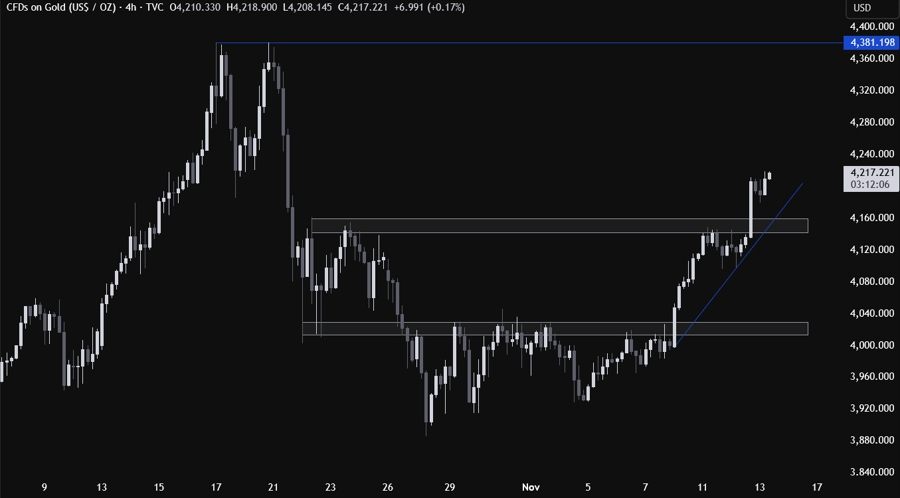
On the 4 hour chart, we can see that we have a strong support zone now around the 4,150 level where we have also the upward trendline for confluence. If we were to get a pullback, we can expect the buyers to lean on the support with a defined risk below it to keep pushing into a new all-time high. The sellers, on the other hand, will want to see the price breaking lower to pile in for a drop into the 4,000 handle next.
Gold Technical Analysis – 1 hour Timeframe
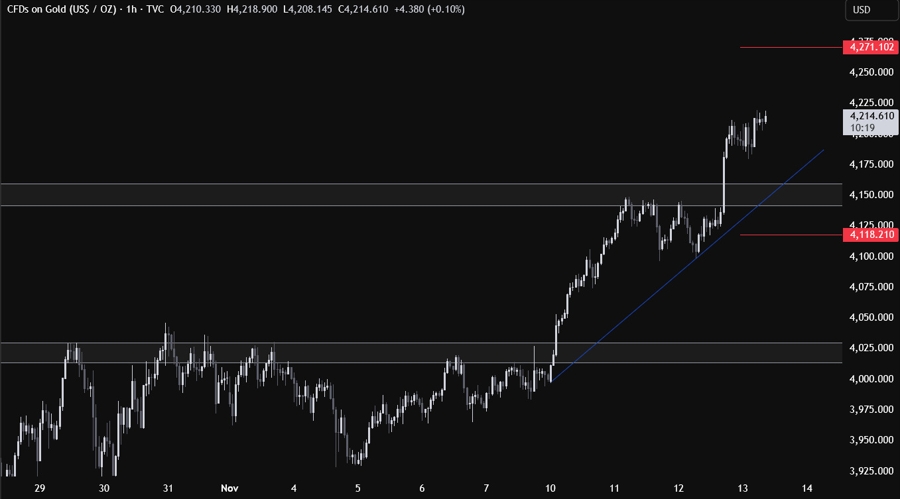
On the 1 hour chart, there’s not much else we can add here as the buyers will likely lean on the trendline to keep pushing into new highs, while the sellers will look for a break lower to target new lows. The red lines define the average daily range for today.


