
Fundamental Overview
Gold continues to slowly push upwards amid the higher December Fed rate cut odds. The recent US labour market data came in on the softer side, which should keep the upward momentum intact into the FOMC meeting.
Looking ahead, everything will depend on the Fed's forward guidance and the following NFP/CPI reports. A more dovish Fed guidance and weak data, should give gold a boost. On the other hand, more hawkish stuff will likely trigger another correction.
In the bigger picture, gold should remain in an uptrend as real yields will likely continue to fall amid the Fed’s dovish reaction function. But in the short term, a further hawkish repricing in interest rate expectations should weigh on the market.
Gold Technical Analysis – Daily Timeframe
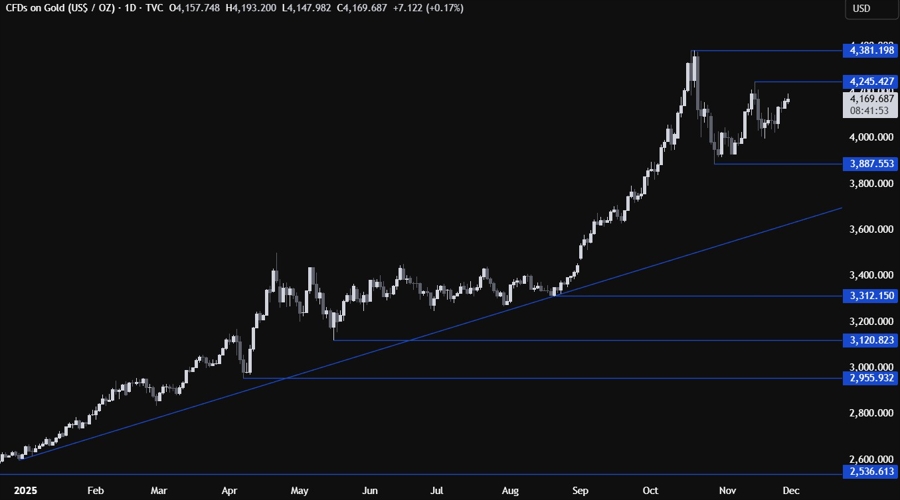
On the daily chart, we can see that gold is slowly approaching the recent highs around the 4245 level. That’s where we can expect the sellers to step in with a defined risk above the level to position for a drop back into the 3887 low. The buyers, on the other hand, will want to see the price breaking higher to increase the bullish bets into new all-time highs.
Gold Technical Analysis – 4 hour Timeframe
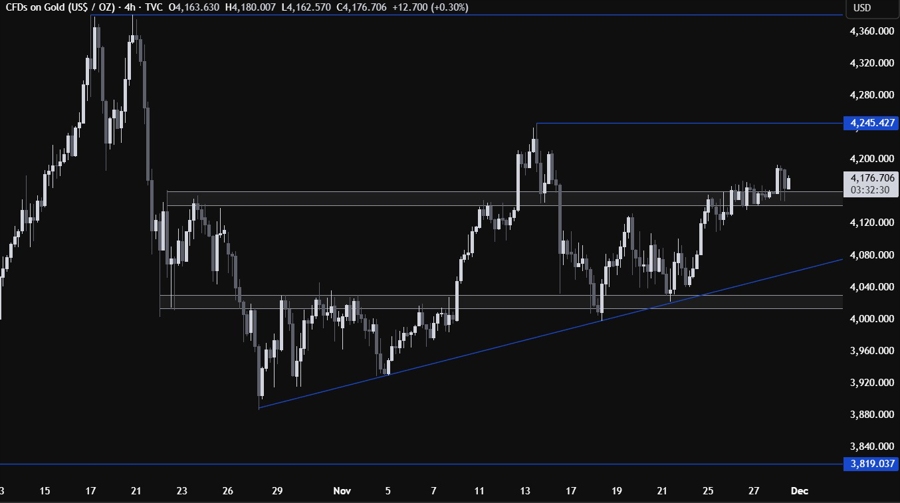
On the 4 hour chart, we can see that the price has finally broke above the strong resistance zone around the 4150 level, opening the door for a move into the 4245 high. The buyers will likely continue to step in around these levels with a defined risk below the support to keep pushing into the 4245 level next. The sellers, on the other hand, will want to see the price falling back below the support to pile in for a drop into the trendline around the 4080 level.
Gold Technical Analysis – 1 hour Timeframe
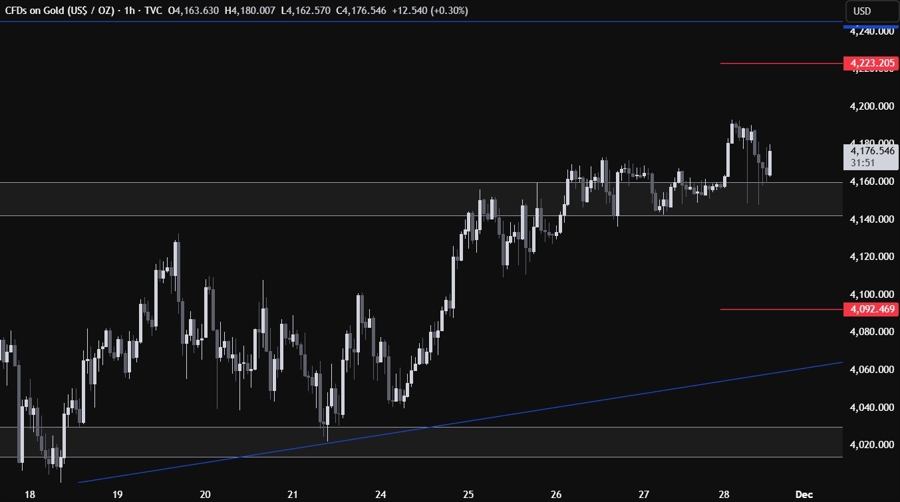
On the 1 hour chart, there’s not much else we can add here as the buyers will likely continue to pile in here to position for a rally into the 4245 level, while the sellers will look for a break lower to target a drop into the 4080 level. The red lines define the average daily range for today.
