Fundamental Overview
Gold broke out of the recent consolidation and surged into the most recent swing high around the 4,150 level. This looks more like a short squeeze than something fundamental. The reopening of the US government should bring back the key US data like the NFP and CPI, and those will be key risk events for gold.
Tomorrow, we have the only important data release for the week as we get the weekly US ADP data. Right now, the Fed is still sounding uncertain about a rate cut in December which is also reflected in the 63% probability priced by the market.
Strong US data, especially on the labour market side, should keep weighing on gold as it would keep the market speculating on rate cuts pause. Conversely, weak data is likely to support the precious metal as it would give the Fed more reasons to keep cutting rates.
In the bigger picture, gold should remain in an uptrend as real yields will likely continue to fall amid the Fed’s dovish reaction function. But in the short term, a further hawkish repricing in interest rate expectations should keep weighing on the market.
Gold Technical Analysis – Daily Timeframe
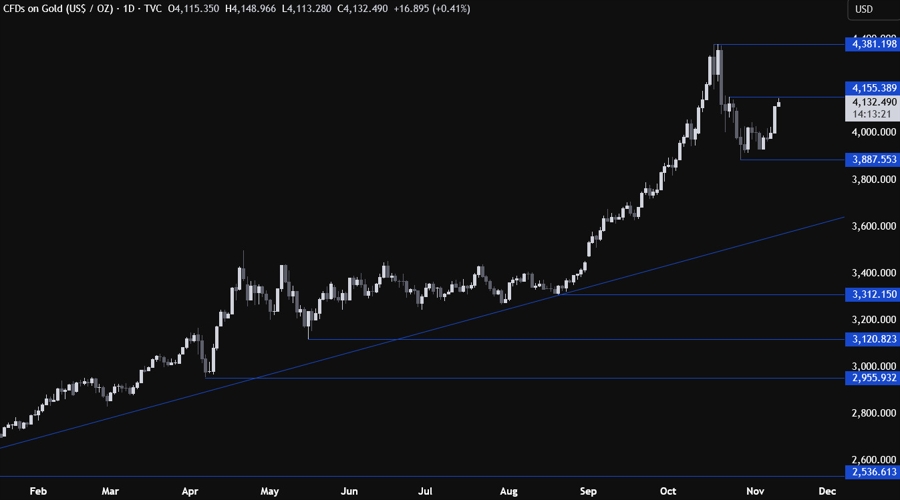
On the daily chart, we can see that gold pulled all the way back to the most recent swing high around the 4,150 level. This is where we can expect the sellers to step in with a defined risk above the level to position for a drop into the 3,800 level next. The buyers, on the other hand, will want to see the price breaking higher to increase the bullish bets into a new all-time high.
Gold Technical Analysis – 4 hour Timeframe
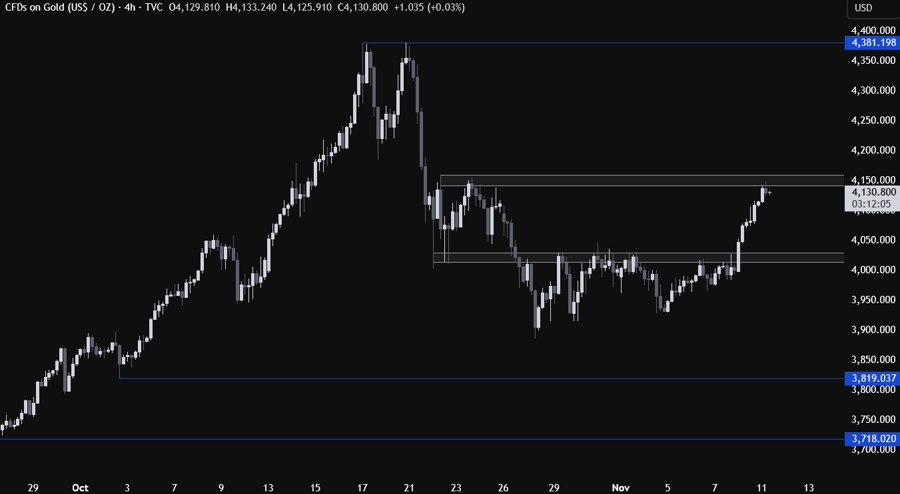
On the 4 hour chart, we can see more clearly the resistance zone around the 4,150 level. Again, this is where we can expect the sellers to step in to position for a drop into new lows, while the buyers will look for a break higher to start targeting a new all-time high.
Gold Technical Analysis – 1 hour Timeframe
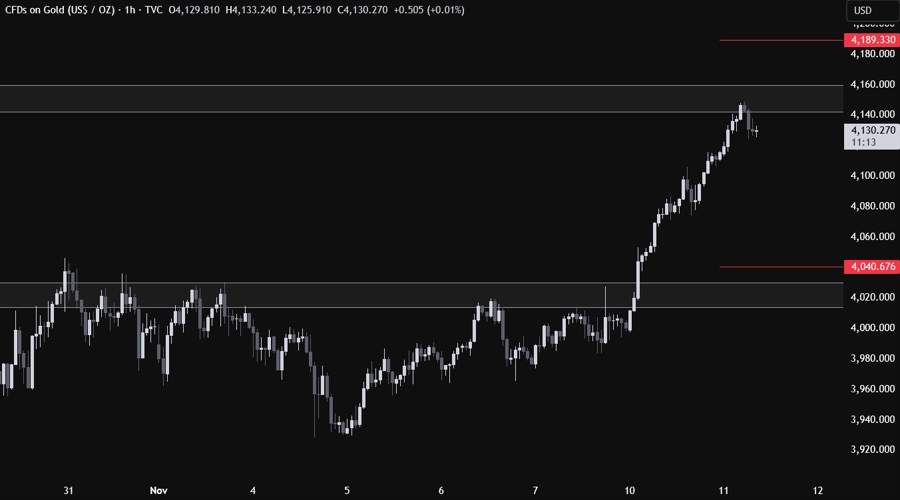
On the 1 hour chart, there’s not much else we can add here as the sellers should step in around these levels with a defined risk above the resistance, while the buyers should wait for a breakout to increase the bullish bets into new highs. The red lines define the average daily range for today.
Upcoming Catalysts
This week is pretty empty on the data front as we just have the weekly US ADP data tomorrow.