
KEY POINTS:
- Soft US core inflation data pushed gold to new all-time highs
- Traders firmed up Fed's rate cut expectations
- Gold remains supported amid strong tailwinds and lack of bearish catalysts
- US Supreme Court decision on tariffs could pose a risk in the short-term
FUNDAMENTAL OVERVIEW
Gold extended the gains into new all-time highs yesterday following the softer than expected US core inflation data. The market firmed up Fed’s rate cuts expectations, although we haven’t seen a meaningful change as the total easing by year-end went from 52 to just 54 bps.
Gold continues to benefit from strong tailwinds like geopolitical tensions, Fed rate cut bets and the recent renewed attacks on Fed independence.
Today, we have a potential US Supreme Court decision on Trump's tariffs and that could pose a risk for the upside in case tariffs are struck down. In fact, such a decision would ease stagflation risks and raise global growth speculations.
I would expect a selloff in gold in the short term on such a positive development even though Trump's officials have already stated that they have a plan to impose tariffs using other means.
GOLD TECHNICAL ANALYSIS – DAILY TIMEFRAME
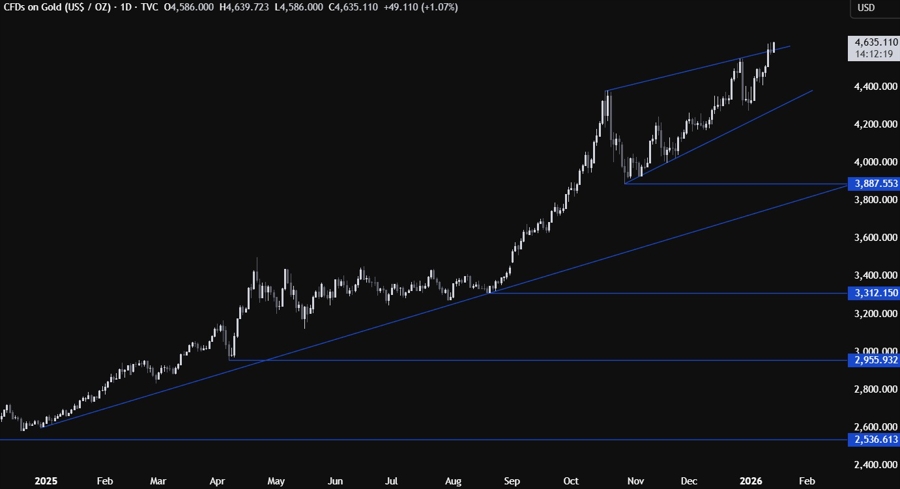
On the daily chart, we can see that gold extended the rally into a new all-time high and it’s now trading above the top trendline. This is where we can expect the buyers to pile in with a defined risk below the top trendline to keep pushing into new highs. The sellers, on the other hand, will want to see the price falling back below the trendline to target a pullback into the bottom trendline around the 4300 level.
GOLD TECHNICAL ANALYSIS – 4 HOUR TIMEFRAME
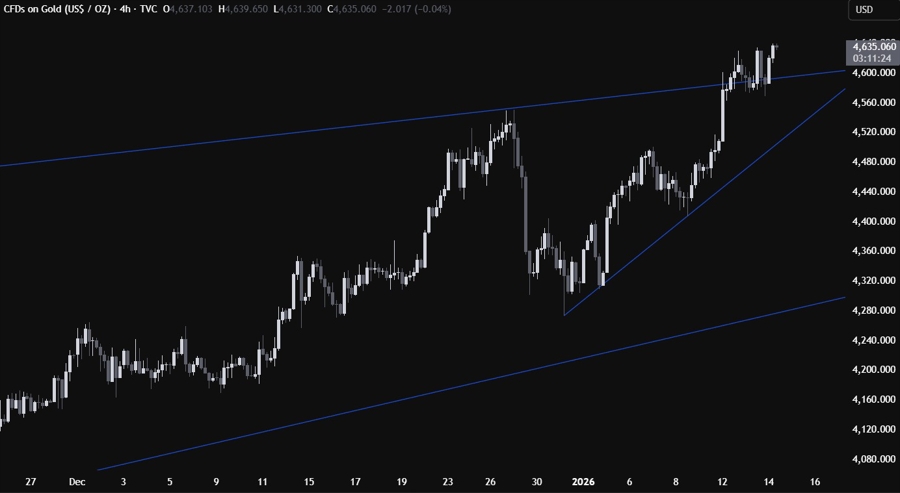
On the 4 hour chart, we can see more clearly the recent break and the consolidation right above the top trendline. We can also see that we have a minor upward trendline defining the bullish momentum. If we get a pullback into the trendline, we can expect the buyers to lean on it with a defined risk below it to position for a rally into new record highs with a better risk to reward setup. The sellers, on the other hand, will look for a break lower to increase the bearish bets into the next major trendline.
GOLD TECHNICAL ANALYSIS – 1 HOUR TIMEFRAME
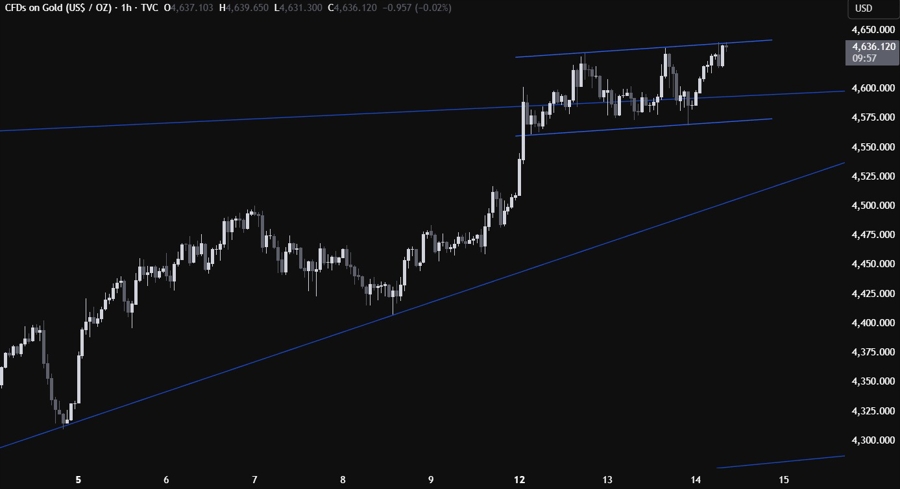
On the 1 hour chart, we can see that the price is consolidating in a tight channel above the top trendline. The buyers will look for opportunities both on the breakout or on a pullback to the lower bound of the channel. The sellers, on the other hand, will likely step in around the upper bound of the channel to target new lows and increase the bearish bets on a downside breakout.
UPCOMING CATALYSTS
Today we get the November US Retail Sales and US PPI reports, so it’s going to be old data. The market will likely focus on the potential US Supreme Court decision on Trump’s tariffs. Tomorrow, we get the latest US Jobless Claims figures.
