
Fundamental Overview
Gold got stuck in a consolidation below the 4245 level recently as the focus turned to the looming FOMC decision on Wednesday. The precious metal has been keeping a bullish bias ever since Fed’s Williams endorsed a December rate cut. The higher rate cut odds have been a tailwind for precious metals.
There’s been nothing in the meantime to stop this momentum as the recent US data came in on the softer side. As things stand, it’s all about the Fed’s forward guidance now and the following NFP and CPI reports. Hawkish stuff should weigh on gold and trigger another correction, while a dovish leaning should keep supporting the upside.
In the bigger picture, gold should remain in an uptrend as real yields will likely continue to fall amid the Fed’s dovish reaction function. But in the short term, a further hawkish repricing in interest rate expectations should weigh on the market.
Gold Technical Analysis – Daily Timeframe
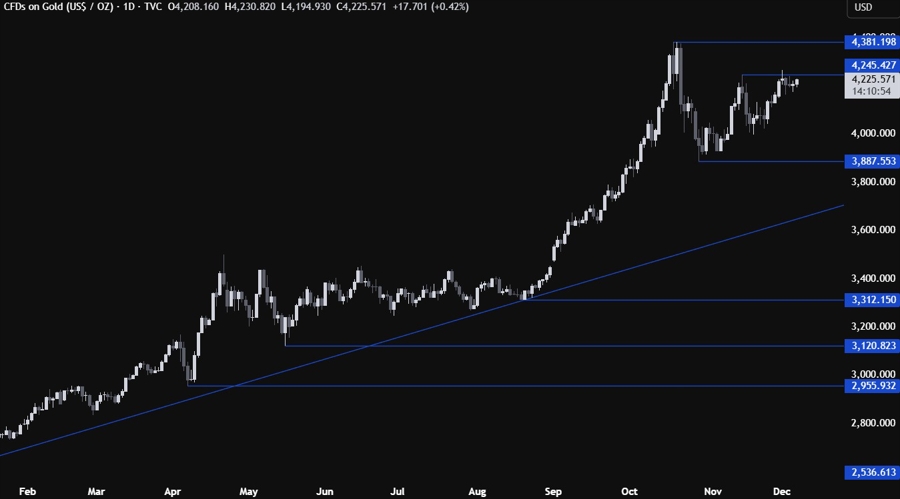
On the daily chart, we can see that gold continues to consolidate below the 4245 level. We can expect the sellers to keep stepping in around this level with a defined risk above it targeting the 4000 level next. The buyers, on the other hand, will want to see the price breaking higher to extend the rally into new all-time highs.
Gold Technical Analysis – 4 hour Timeframe
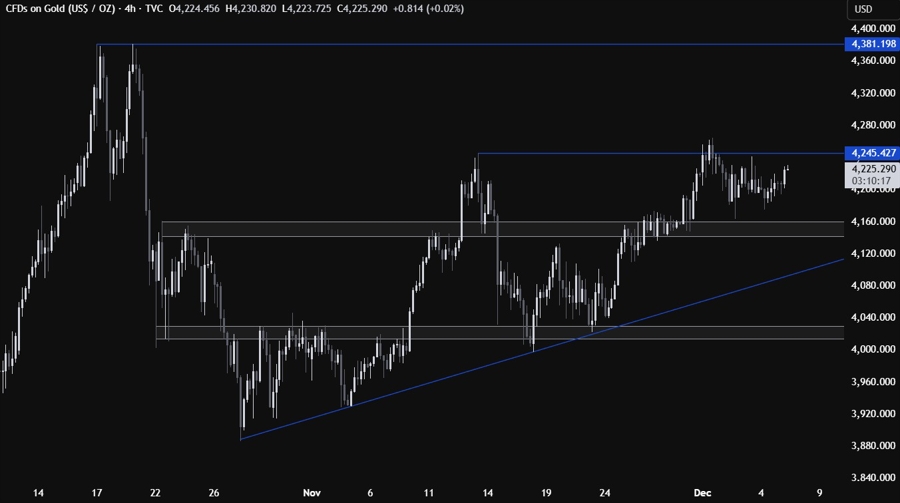
On the 4 hour chart, we can see more clearly the consolidating between the 4245 resistance and the 4150 support. The market participants will likely continue to play the range by buying at support and selling at resistance until we get a breakout on either side.
Gold Technical Analysis – 1 hour Timeframe
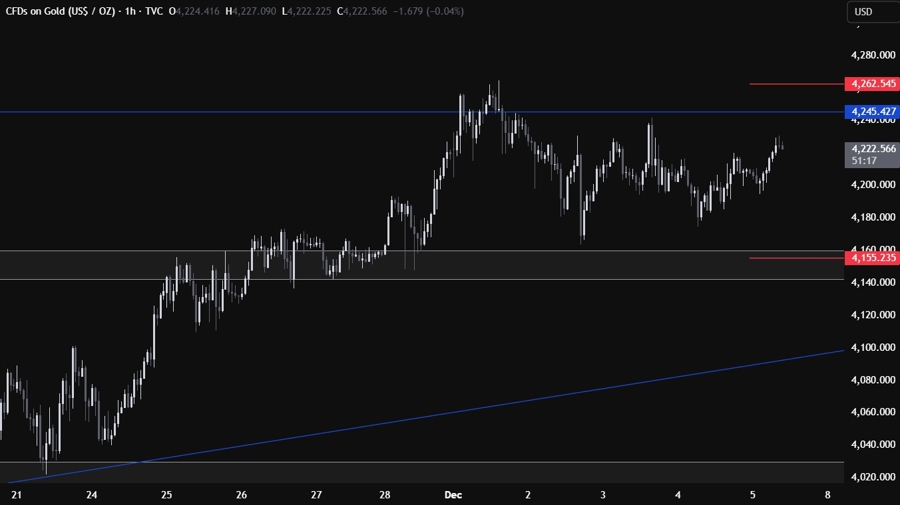
On the 1 hour chart, there’s not much else we can add here as the buyers will continue to step in around the support or wait for a break above the resistance, while the sellers will continue to pile in around the resistance or wait for a break below the support. The red lines define the average daily range for today.
Upcoming Catalysts
Today we conclude the week with the September US PCE price index and the University of Michigan Consumer Sentiment report.
