
FUNDAMENTAL OVERVIEW
Gold extended the gains into new highs since the negative Monday open as the risk sentiment turned around following several positive news and reports that increased the probabilities of a peace deal between US and Iran.
The second round of negotiations are expected to start tomorrow. Trump delivered some upbeat remarks tonight mentioning that we’re going to be watching an amazing two days ahead. The markets have been positioning into a peace deal since Monday and the easing in financial conditions kept gold prices supported.
Everything now hinges on US-Iran talks. If negotiations were to break down again, we might see a pullback in gold, but as long as the ceasefire holds, the downside could remain limited. On the other hand, a peace deal might give gold another boost to extend the rally into new highs.
GOLD TECHNICAL ANALYSIS – DAILY TIMEFRAME
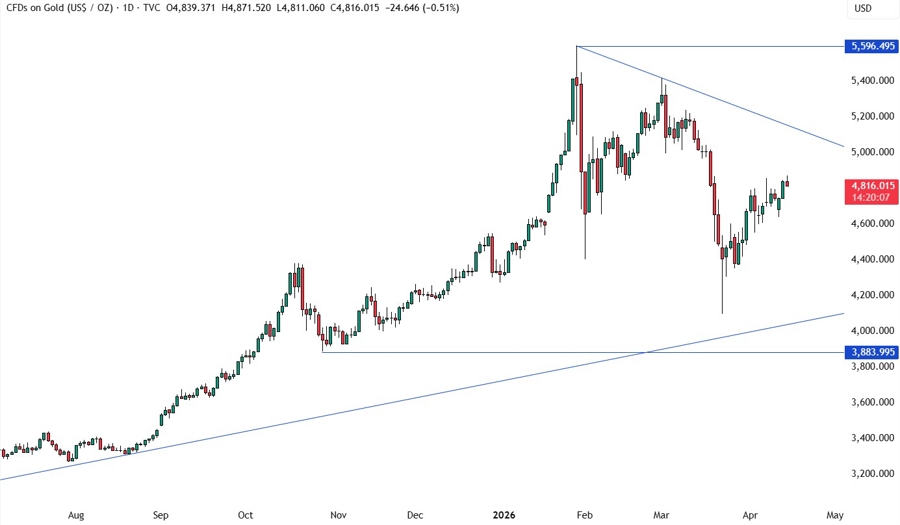
On the daily chart, we can see that gold is continuing to edge higher into the downward trendline around the 5,000 level. If the price gets there, we can expect the sellers to lean on the trendline with a defined risk above it to position for a drop into the major upward trendline around the 4,200 level. The buyers, on the other hand, will look for a break to increase the bullish bets into the 5,400 level next.
GOLD TECHNICAL ANALYSIS – 4 HOUR TIMEFRAME
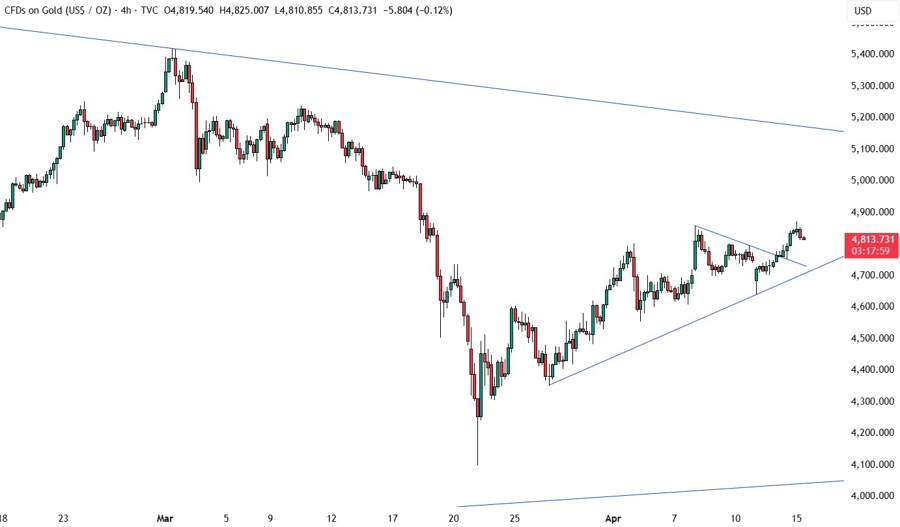
On the 4 hour chart, the price broke above the counter-trendline and extended the gains as more buyers piled in. If we get a pullback into the upward trendline that is defining the bullish momentum, we can expect the buyers to lean on trendline with a defined risk below it to keep pushing into new highs. The sellers, on the other hand, will look for a break lower to pile in for a drop into the major upward trendline.
GOLD TECHNICAL ANALYSIS – 1 HOUR TIMEFRAME
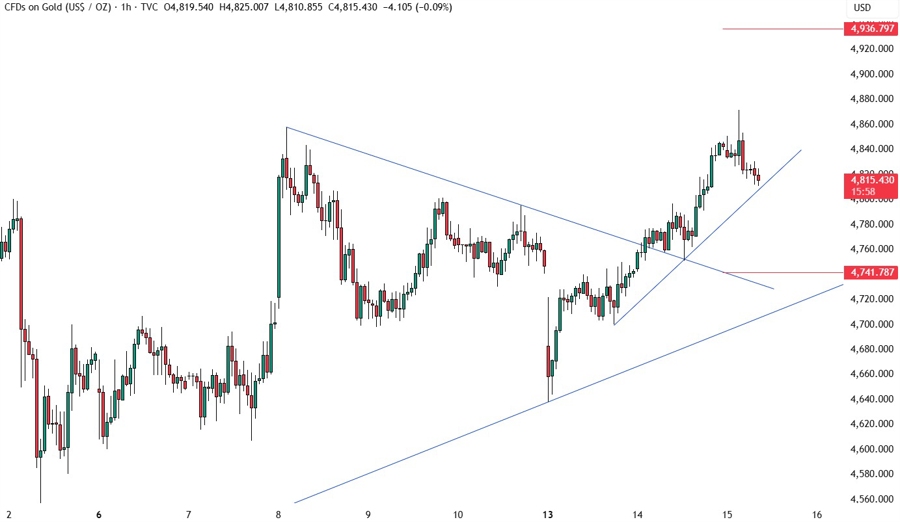
On the 1 hour chart, we have a minor upward trendline defining the current bullish momentum. The buyers will likely continue to lean on the trendline to keep pushing into new highs, while the sellers will look for a break extend the pullback into the next trendline. The red lines define the average daily range for today.
UPCOMING CATALYSTS
Tomorrow we get the latest US Jobless Claims figures, but the focus remains on the second round of US-Iran negotiations expected in the next two days.


