
FUNDAMENTAL OVERVIEW
Gold got a boost yesterday after the announcement of a two-week ceasefire as easing financial conditions supported a broader risk-on sentiment. However, those gains were later wiped out when Israel launched an attack on Lebanon, triggering backlash, with Iran insisting that Lebanon was included in the ceasefire agreement.
For now, the ceasefire is still holding, at least until tomorrow, when the US-Iran negotiations are set to take place in Islamabad. The talks could be extended if both sides agree.
There’s still a risk that the conflict could restart at any moment, since the US and Iran have not officially ended the hostilities. Nonetheless, the short-term bias has turned more bullish for gold, as traders reprice the hawkish expectations. Having said that, the sentiment could reverse quickly if negotiations fail and the war resumes.
GOLD TECHNICAL ANALYSIS – DAILY TIMEFRAME
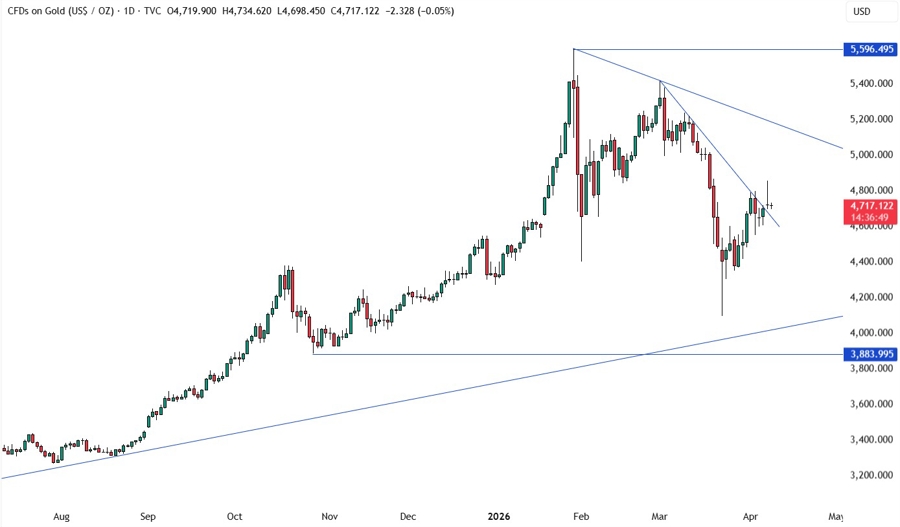
On the daily chart, we can see that gold broke above the trendline yesterday following the ceasefire announcement. The buyers will likely continue to pile in around these levels with a defined risk below the most recent swing low to keep targeting the trendline around the 5,000 level. The sellers, on the other hand, will look for a break below the swing low at 4,555 to regain control and position for a drop into the 4,000 level next.
GOLD TECHNICAL ANALYSIS – 4 HOUR TIMEFRAME
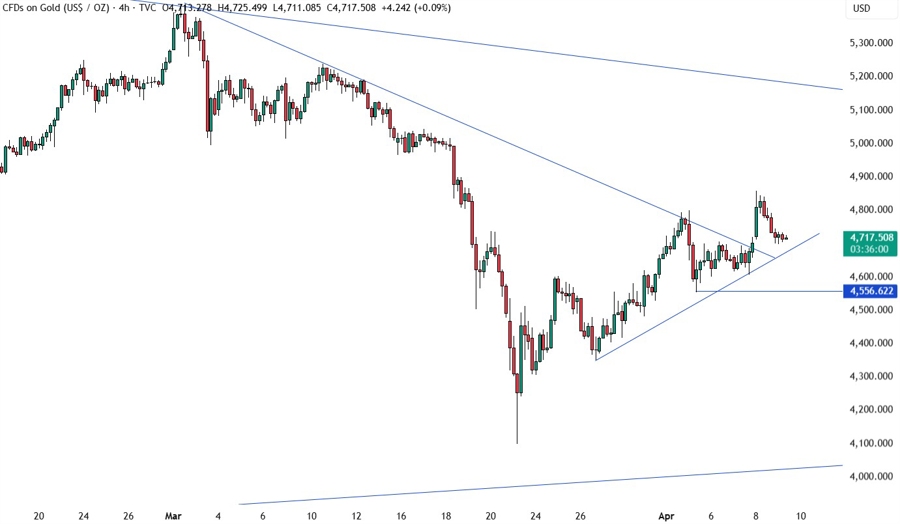
On the 4 hour chart, we have an upward trendline defining the bullish momentum. The buyers will likely lean on the trendline with a defined risk below it to keep pushing into new highs. The sellers, on the other hand, will look for a break to extend the pullback into the swing low around the 4,555 level.
GOLD TECHNICAL ANALYSIS – 1 HOUR TIMEFRAME
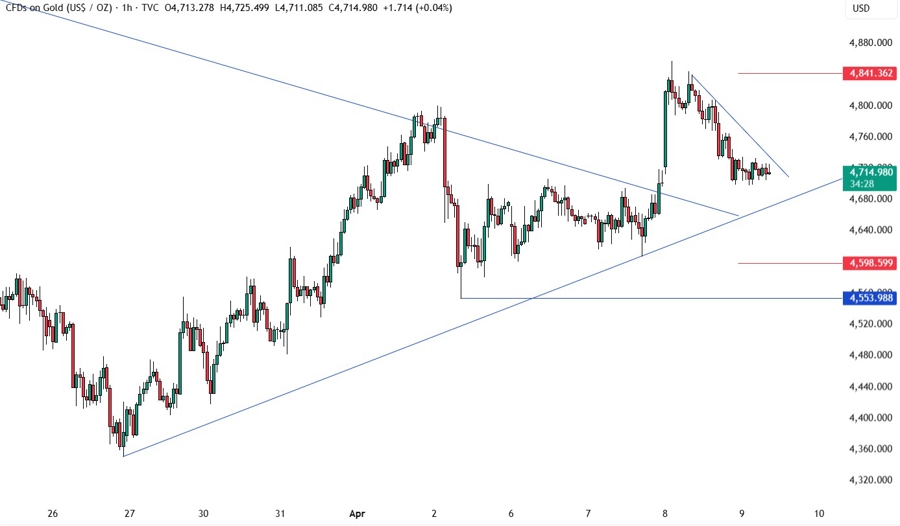
On the 1 hour chart, we have a counter-trendline defining the pullback into the upward trendline. The sellers will likely continue to lean on the trendline to keep pushing into new lows, while the buyers will look for a break to pile in for a rally into the 5,000 level. The red lines define the average daily range for today.
UPCOMING CATALYSTS
Today we get the US PCE price index and the latest US Jobless Claims figures. Tomorrow, we conclude the week with the US CPI report and the University of Michigan Consumer Sentiment survey. The market focus is now on the US-Iran negotiations expected for tomorrow in Islamabad.


