
FUNDAMENTAL OVERVIEW
Gold probed below the tight range yesterday as the week started on a negative note, but eventually the price returned inside the range as the sentiment improved in the American session. The focus remains on the US-Iran war and the disruption in the Strait of Hormuz, but as of now, there was no real change.
The only thing of note were the reports saying that US and Iran have been in direct contacts recently, which gave the markets some hope on a potential de-escalation but Iran was quick to dismiss such expectations.
For now, gold will likely remain rangebound until we get some new development on the US-Iran front. Attention will also turn to Wednesday’s FOMC decision While the Fed is widely expected to leave policy unchanged, a clearly dovish tone could provide some support for gold. Conversely, any hawkish shift might trigger a downside breakout and push prices to new lows.
Looking ahead, the relief from a clear de-escalation should be positive for gold, since expectations for rate cuts would likely return. What happens next, however, will largely depend on upcoming US data.
If the data starts to show signs of weakness, the market will probably increase the bets on rate cuts, which should push gold to new highs. On the other hand, if the data continues to come in strong, gold will likely stay rangebound or potentially move lower.
GOLD TECHNICAL ANALYSIS – DAILY TIMEFRAME
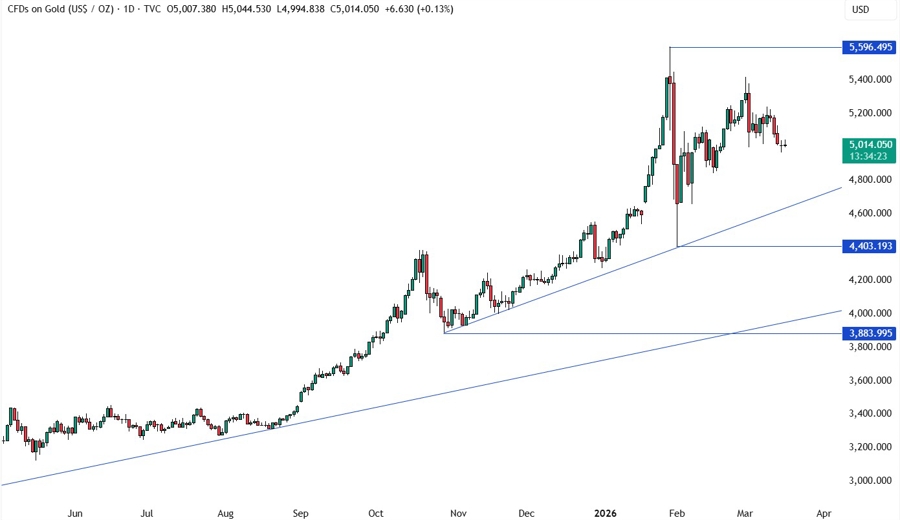
On the daily chart, we can see that gold is still consolidating just above the 5,000 level with traders awaiting new catalysts for the next direction. There’s not much we can glean from this timeframe, so we need to zoom in to see some more details.
GOLD TECHNICAL ANALYSIS – 4 HOUR TIMEFRAME
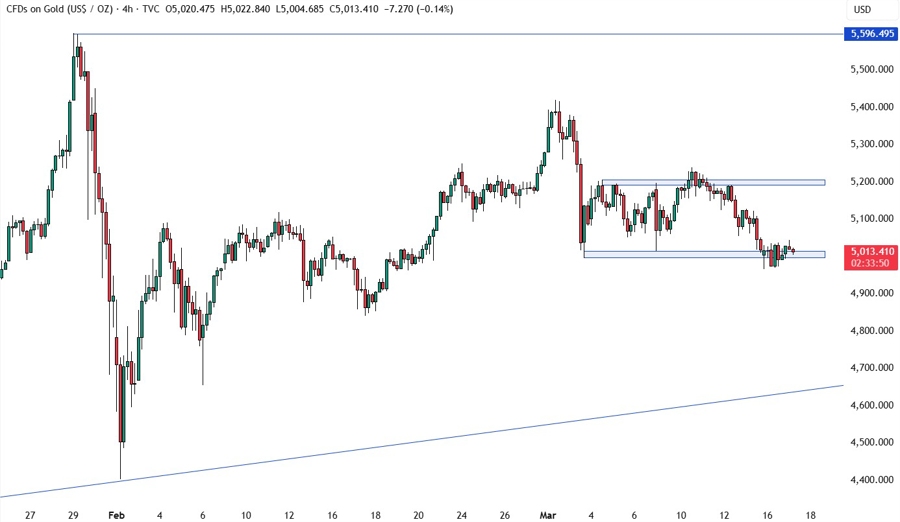
On the 4 hour chart, we can see more clearly the consolidation between the 5,000 support and the 5,200 resistance. The price briefly probed below the support this time but eventually returned inside the range. The market participants will continue to play the range by buying at support and selling at resistance until we get a clear breakout on either side.
GOLD TECHNICAL ANALYSIS – 1 HOUR TIMEFRAME
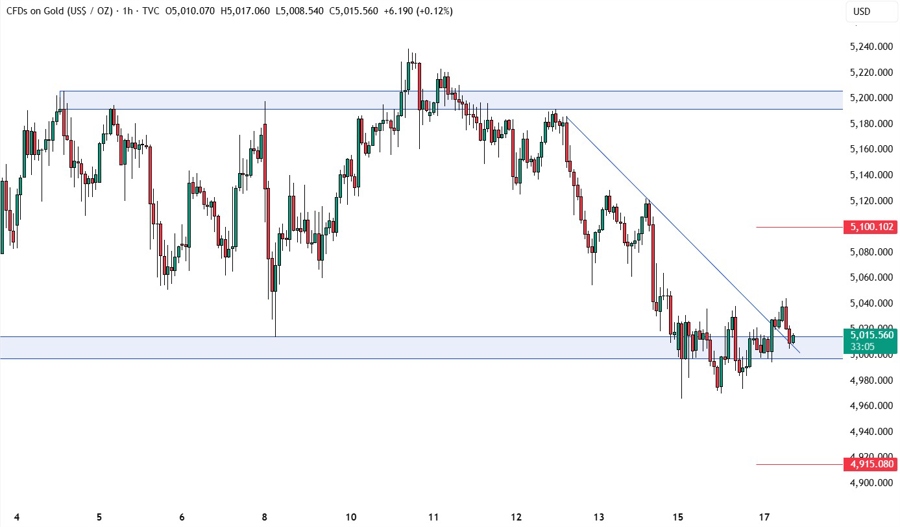
On the 1 hour chart, we can see that the price broke above the downward trendline that was defining the bearish momentum into the support. We can expect the buyers to step in around these levels with a defined risk below the support to position for a rally back into the resistance. The sellers, on the other hand, will look for a break below the support to pile in for a drop into the 4,840 level next. The red lines define the average daily range for today.
UPCOMING CATALYSTS
Tomorrow we have the US PPI report and the FOMC policy decision. On Thursday, we get the latest US Jobless Claims figures. The focus remains on the US-Iran war, so keep an eye on the headlines, especially those regarding the Strait of Hormuz.
