
KEY POINTS:
- Gold remains stuck in a tight consolidation awaiting a breakout
- Mixed signals from US data leads to uncertainty on future Fed interest rates path
- Fed members are keeping a neutral stance with no clear hint on the timing for the next move
- US-Iran tensions remain in the spotlight
- Traders are still awaiting the US Supreme Court decision on Trump's tariffs
FUNDAMENTAL OVERVIEW
Gold continues to consolidate around the all-time highs as traders await new catalysts for the next direction. We have been getting some mixed signals in terms of US data recently that might have capped the momentum. In fact, US core inflation missed expectations leading to a slightly dovish repricing, but the strong US jobless claims yesterday erased those bets. Fed members have been keeping a neutral stance with no clear signal on the timing of the next cut.
On the geopolitical front, eyes are mainly on the US-Iran tensions. We got a small pullback in gold on Wednesday after Trump seemed to suggest that a military action was no longer on the table, but we also got reports from Fox News yesterday saying that US military assets were heading to the Middle East. This uncertainty is keeping traders on the edge.
Lastly, we are still awaiting the US Supreme Court decision on Trump’s tariffs which could lead to some downside in gold in the short-term in case tariffs are struck down. In fact, such a decision would ease stagflation risks and raise global growth prospects.
GOLD TECHNICAL ANALYSIS – DAILY TIMEFRAME
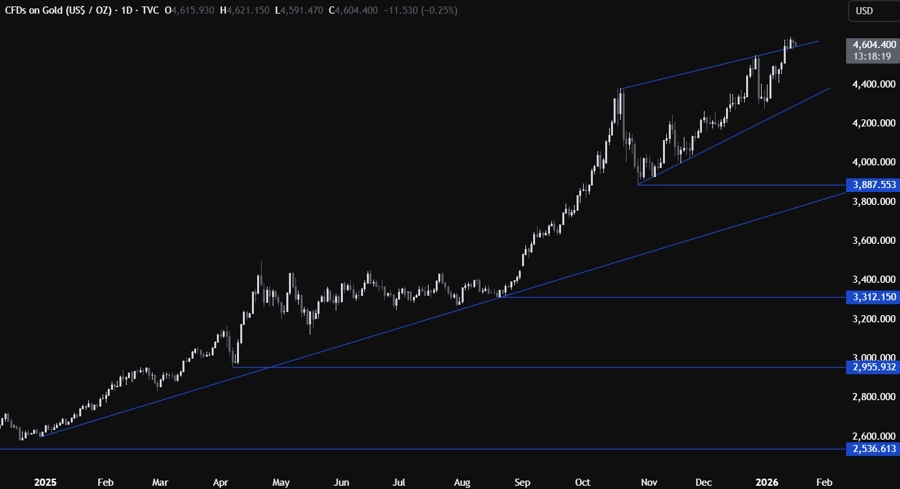
On the daily chart, we can see that gold is still consolidating above the top trendline. The buyers continue to pile in with a defined risk below the trendline to keep pushing into new highs. The sellers, on the other hand, will want to see the price falling back below the trendline to target a pullback into the bottom trendline around the 4300 level.
GOLD TECHNICAL ANALYSIS – 4 HOUR TIMEFRAME
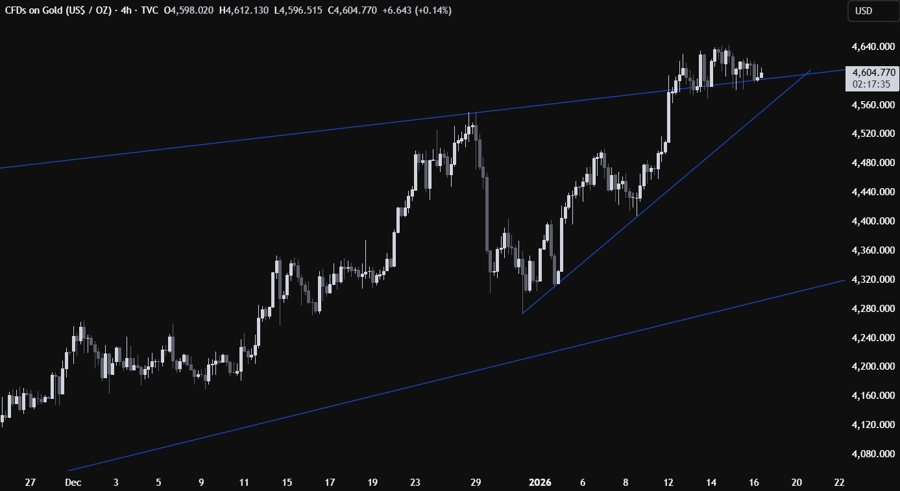
On the 4 hour chart, we can see more clearly the consolidation above the top trendline. We can also see that we have a minor upward trendline defining the bullish momentum. If we get a pullback into the trendline, we can expect the buyers to lean on it with a defined risk below it to position for a rally into new record highs with a better risk to reward setup. The sellers, on the other hand, will look for a break lower to increase the bearish bets into the next major trendline.
GOLD TECHNICAL ANALYSIS – 1 HOUR TIMEFRAME
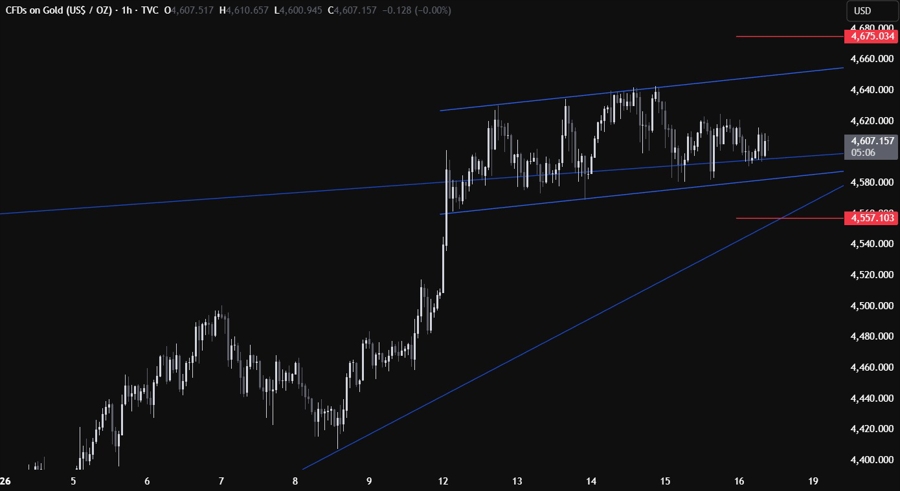
On the 1 hour chart, we can see that the price is confined in a tight channel above the top trendline. The buyers will look for dip-buying opportunities around the bottom of the channel and the trendline, while the sellers will look for downside breaks to pile in for new lows and target the next major trendline. The red lines define the average daily range for today.
UPCOMING CATALYSTS
Today we get the November US Retail Sales and US PPI reports, so it’s going to be old data. The market will likely focus on the potential US Supreme Court decision on Trump’s tariffs. Tomorrow, we get the latest US Jobless Claims figures.
