
FUNDAMENTAL OVERVIEW
Gold has been in recovery mode in this first half of the week after experiencing one of the worst drawdowns in decades. The fundamentals are still against rising prices, so we either get stuck in a wide range below the January’s high or will see another flush lower in the next weeks or months.
In fact, on Monday we got a strong US ISM Manufacturing PMI with the new orders index jumping to the highest level since 2022. The data didn’t trigger another selloff as the Fed is mostly focused on the labour market and inflation, but the risks for further downside remain.
Today, we have the US ADP and the US ISM Services PMI on the agenda. If we get surprisingly strong data, we will likely see a hawkish repricing in interest rates expectations which could weigh on gold. If the data comes out soft, on the other hand, the recovery could extend into new highs as we await the NFP report next.
GOLD TECHNICAL ANALYSIS – DAILY TIMEFRAME
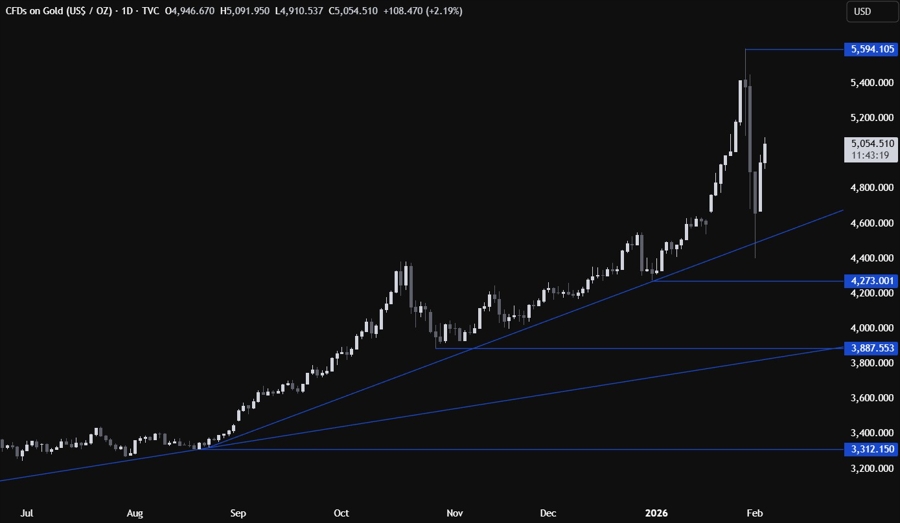
On the daily chart, we can see that gold recovered more than half of the losses as the dip-buyers continue to pile in to target new record highs. There’s not much we can glean from this timeframe, so we need to zoom in to see some more details.
GOLD TECHNICAL ANALYSIS – 4 HOUR TIMEFRAME
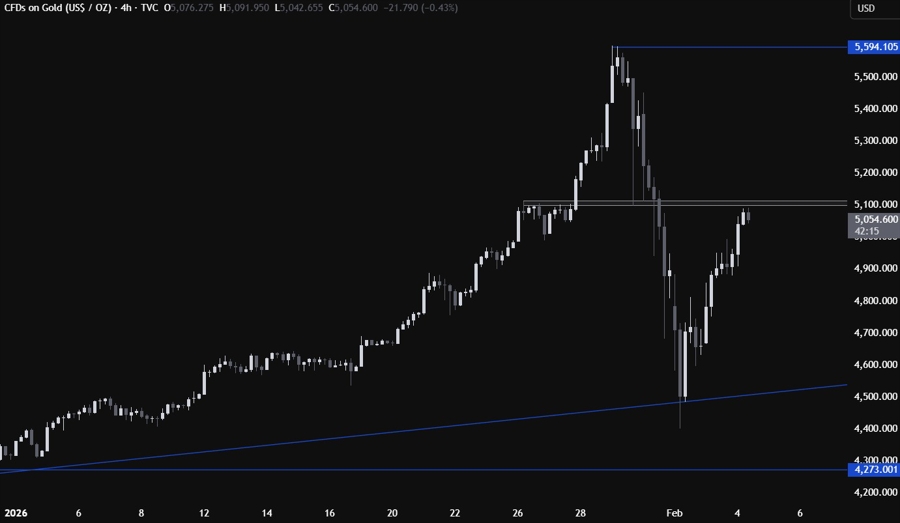
On the 4 hour chart, we can see that we have a resistance zone around the 5100 level. This is where we can expect the sellers to step in with a defined risk above the resistance to position for a drop back into the lows. The buyers, on the other hand, will look for a break higher to increase the bullish bets into new all-time highs.
GOLD TECHNICAL ANALYSIS – 1 HOUR TIMEFRAME
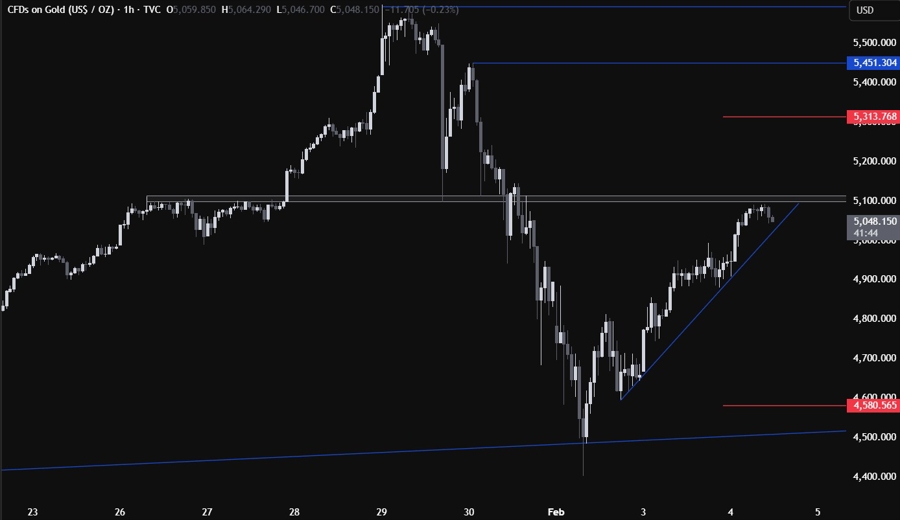
On the 1 hour chart, we can see that we have a minor upward trendline defining the bullish momentum. The buyers will likely continue to lean on the trendline with a defined risk below it to keep pushing into new highs, while the sellers will look for a break lower to increase the bearish bets into new lows. The red lines define the average daily range for today.
UPCOMING CATALYSTS
Today we have the US ADP and the US ISM Services PMI. Tomorrow, we get the US Jobless Claims figures. On Friday, we conclude the week with the University of Michigan Consumer Sentiment data.


