
FUNDAMENTAL OVERVIEW
Gold has been regaining some ground over the past few days, supported by a couple of optimistic developments on the US-Iran front. On Monday, prices jumped after Trump announced on his Truth Social account a five-day ceasefire aimed at paving the way for “a complete and total resolution of the hostilities”. However, the rally lost momentum as Iran denied Trump’s claims.
Late yesterday, gold moved higher again after Israel’s Channel 12 reported that a month-long ceasefire could be announced while the US and Iran negotiate 15 key points. Traders are now waiting to see whether Iran will accept the plan. If it does, gold could extend its gains toward the 5,000 level. On the other hand, a rejection might put prices back under pressure, potentially dragging gold down toward 4,000.
GOLD TECHNICAL ANALYSIS – DAILY TIMEFRAME
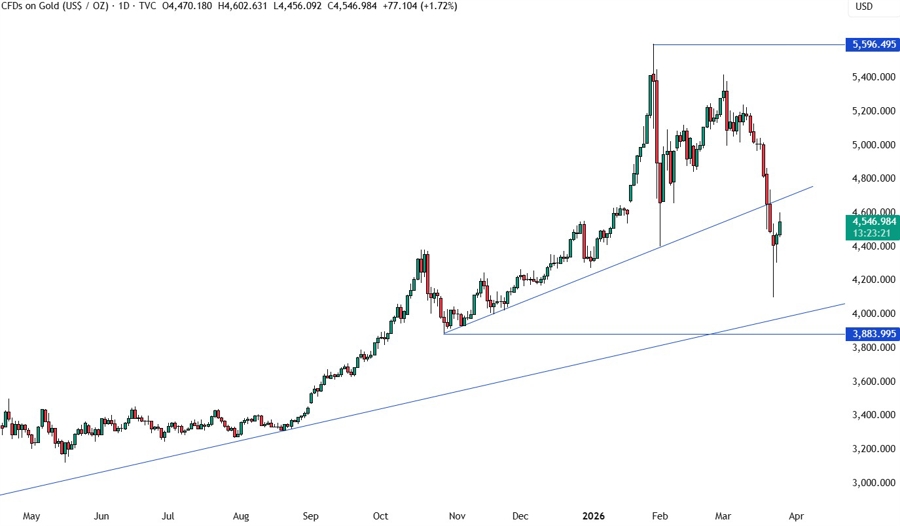
On the daily chart, we can see that gold bounced near the 4,100 level as the selloff failed to extend into the trendline around the 4,000 level. If the price reverses again and falls into the trendline, we can expect the buyers to step in with a defined risk below the 3,883 level to position for a rally into new all-time highs. The sellers, on the other hand, will look for a break lower to increase the bearish bets into the 3,400 level next.
GOLD TECHNICAL ANALYSIS – 4 HOUR TIMEFRAME
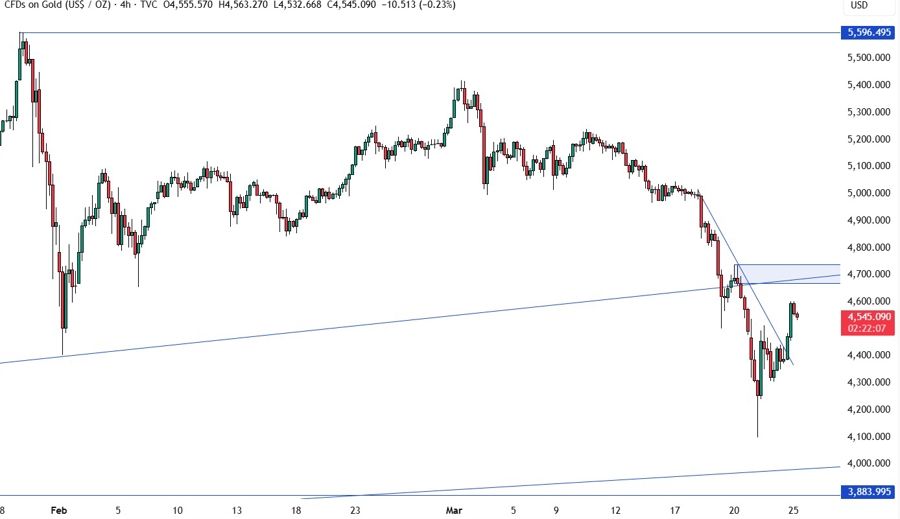
On the 4 hour chart, we can see the price broke above the downward trendline yesterday and shot higher as more buyers piled in targeting the 4,700 level where we have the most recent swing high and the broken trendline. If the price gets there, we can expect the sellers to step in with a defined risk above the resistance to position for a drop into the 4,000 level. The buyers, on the other hand, will look for a break higher to increase the bullish bets into the 5,000 level next.
GOLD TECHNICAL ANALYSIS – 1 HOUR TIMEFRAME
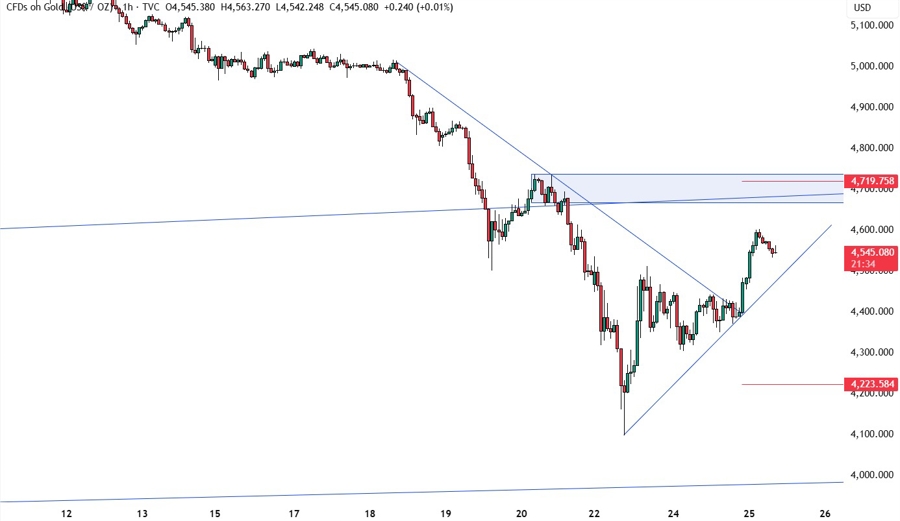
On the 1 hour chart, we have a minor upward trendline defining the bullish momentum on this timeframe. If we get a pullback, we can expect the buyers to lean on the trendline with a defined risk below it to keep pushing into new highs. The sellers, on the other hand, will look for a break lower to pile in for a drop into the 4,000 level next. The red lines define the average daily range for today.
UPCOMING CATALYSTS
Tomorrow we get the latest US Jobless Claims figures and a potential US-Iran meeting in Islamabad. The focus is now on US-Iran negotiations.


