
FUNDAMENTAL OVERVIEW
Gold started to rally steadily on Friday after we got various reports of evacuations that indicated a possible strike to follow over the weekend. Sure enough, the US and Israel launched a coordinated attack against various Iran’s targets that included key officials and military facilities.
Their operation managed to kill Iran’s Supreme Leader Khamenei and many other regime officials. Iran responded with broad attacks against Israel and US bases in various Gulf regions like Jordan, Kuwait, Bahrain, Qatar, Iraq, Saudi Arabia, and the United Arab Emirates aimed at building pressure to end the war. The Strait of Hormuz is virtually closed as traffic fell sharply after at least three ships were attacked.
Gold opened with a positive gap and, after a little pullback during the Asian session, started rising again towards the all-time highs. The main risk for gold buyers is now a de-escalation, while a prolonged war should keep the precious metal supported into new record highs.
GOLD TECHNICAL ANALYSIS – DAILY TIMEFRAME
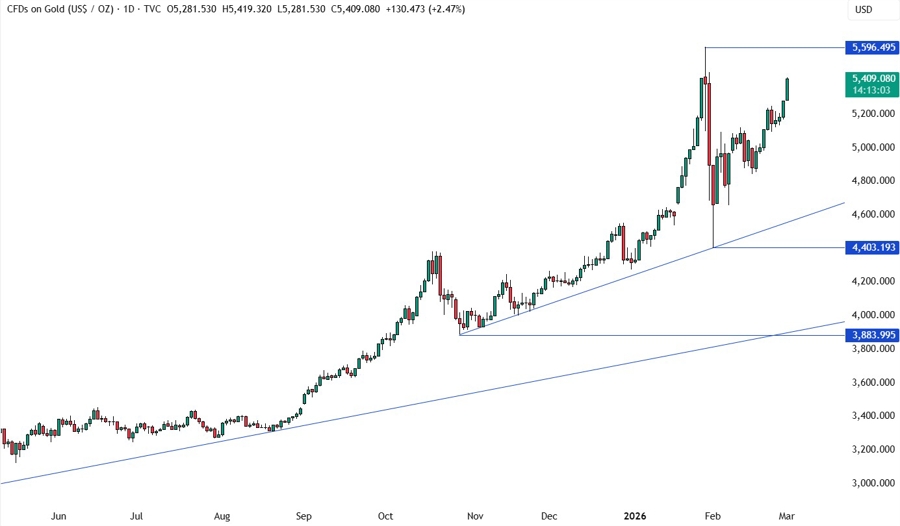
On the daily chart, we can see that gold extended the gains above the 5,400 level as the US-Iran conflict triggered a flight to safety. The all-time highs are now the natural target. That’s where we can expect the sellers to step in with a defined risk above the record highs to position for a drop back into the major trendline around the 4,600 level. The buyers, on the other hand, will look for a break higher to increase the bullish bets into new record highs.
GOLD TECHNICAL ANALYSIS – 4 HOUR TIMEFRAME
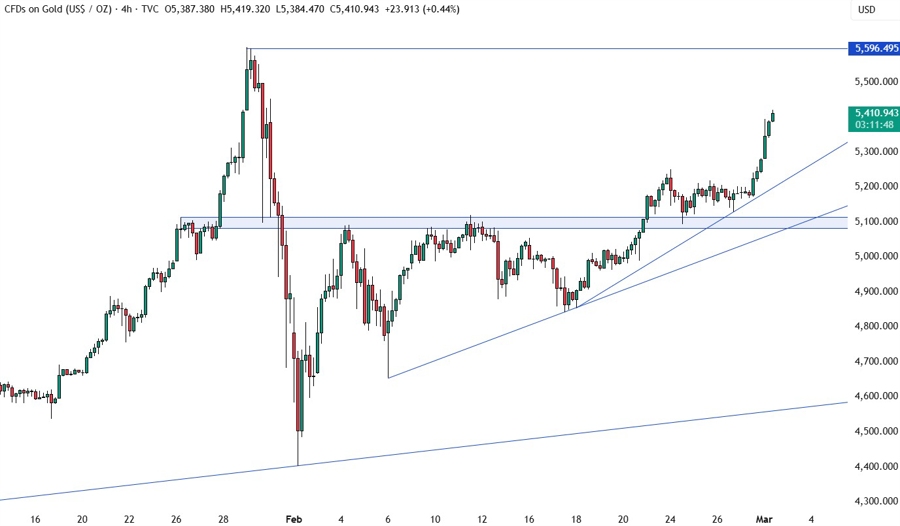
On the 4 hour chart, we can see an upward trendline defining the bullish momentum. If we get a pullback into the trendline, we can expect the buyers to lean on it with a defined risk below it to keep pushing into new highs. The sellers, on the other hand, will look for a break lower to extend the pullback into the 5,100 support where there’s another trendline for confluence.
GOLD TECHNICAL ANALYSIS – 1 HOUR TIMEFRAME
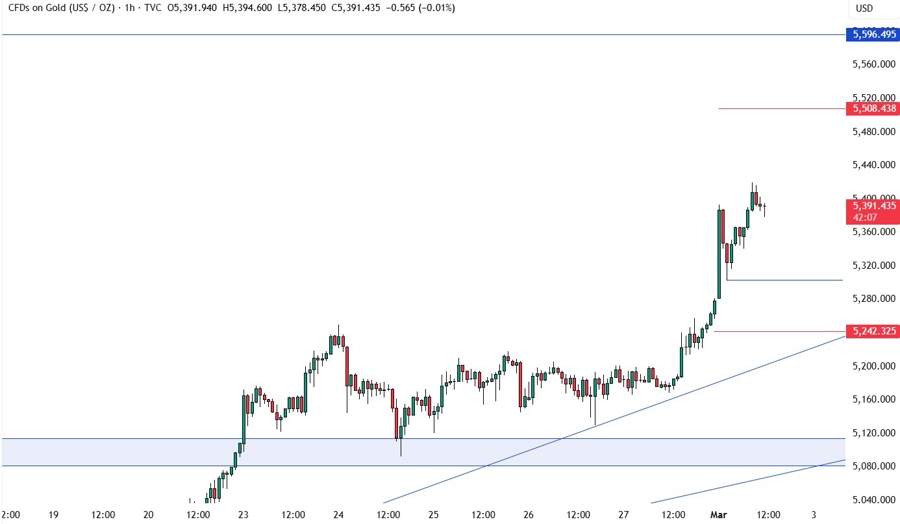
On the 1 hour chart, we can see that the break above the recent high saw more buyers piling in as people are now trying to chase the price into new all-time highs. From a risk management perspective, the buyers will have a better risk to reward setup around the most recent swing low at 5,300 to keep pushing into new highs. The sellers, on the other hand, will look for a break lower to extend the pullback into the trendline around the 5,240 level. The red lines define the average daily range for today.
UPCOMING CATALYSTS
Today we get the US ISM Manufacturing PMI. On Wednesday, we have the US ADP and the US ISM Services PMI. On Thursday, we get the latest US Jobless Claims figures. On Friday, we conclude the week with the US NFP report. The data might not matter much this week amid the US-Iran conflict.
