
FUNDAMENTAL OVERVIEW
Gold is slowly erasing the gains as traders are getting increasingly worried of the risk of an escalation over the weekend. Trump has been jawboning the markets throughout the entire week with ceasefire comments and claims that Iran has been “begging” him for a deal. Meanwhile, the US military buildup in the Middle East increased the speculations of a potential ground invasion.
Late yesterday, Trump extended the ceasefire through April 6, right as major equity indices were on the verge of breaking to new monthly lows and Treasury yields were pushing toward fresh highs. He claimed Iran requested the extension, though Iranian officials denied it.
It looked like another attempt to jawbone the markets, but this time it didn’t have the same impact as earlier in the week. We might see more hedging into the weekend which is likely to put pressure on gold prices throughout the day.
GOLD TECHNICAL ANALYSIS – DAILY TIMEFRAME
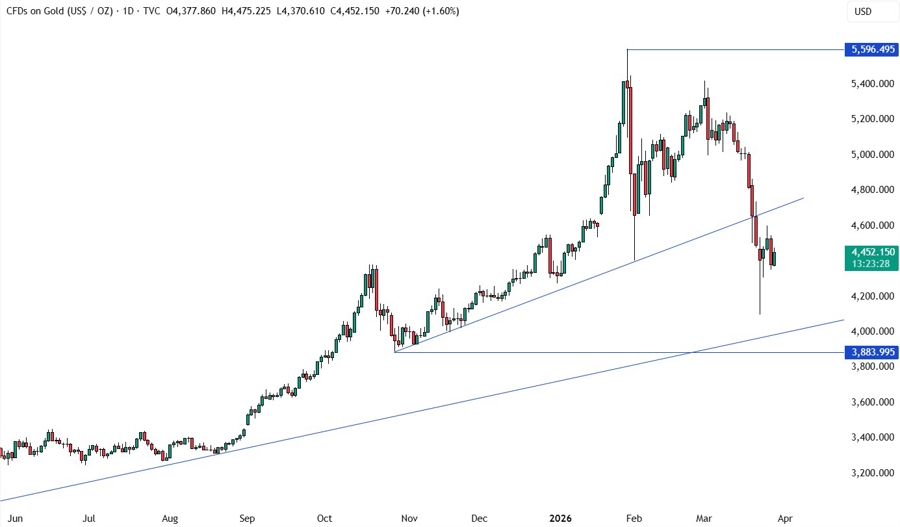
On the daily chart, we can see that gold is trading right between the two major trendlines as Trump’s ceasefire stopped the selloff, but the uncertainty keeps the upside limited. There’s not much we can glean from this timeframe, so we need to zoom in to see some more details.
GOLD TECHNICAL ANALYSIS – 4 HOUR TIMEFRAME
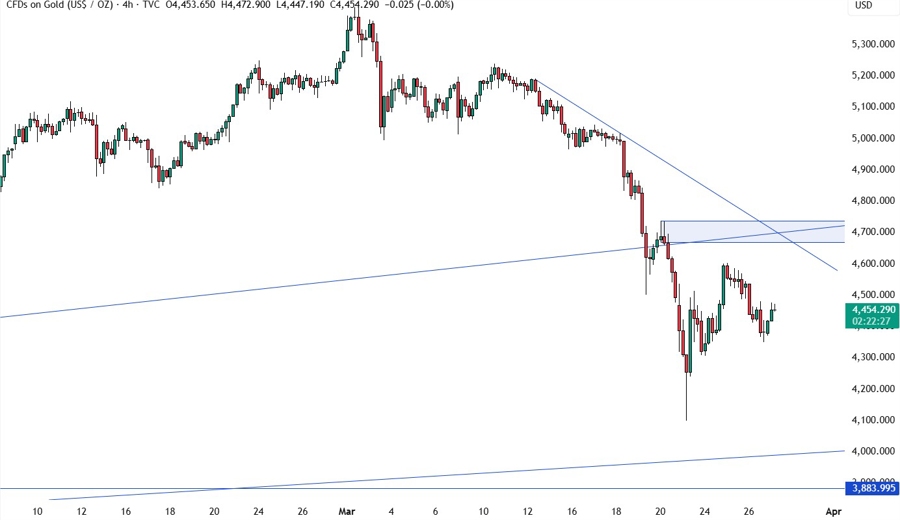
On the 4 hour chart, we have a strong resistance zone around the 4,700 level where we have the confluence of the downward trendline and the broken upward trendline. If the price gets there, we can expect the sellers to step in with a defined risk above the resistance to position for a drop into the major trendline around the 4,000 level. The buyers, on the other hand, will look for a breakout to increase the bullish bets into the 5,000 level next.
GOLD TECHNICAL ANALYSIS – 1 HOUR TIMEFRAME
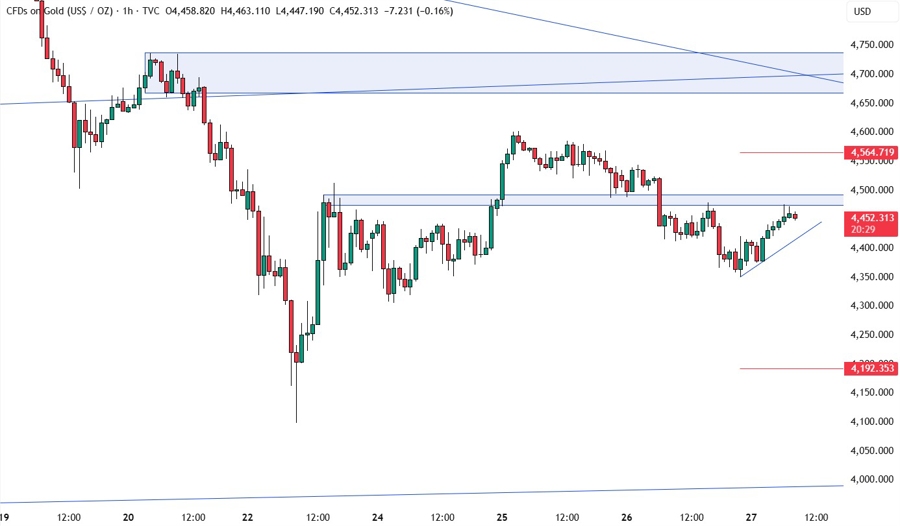
On the 1 hour chart, we have a minor resistance zone around the 4,485 level. This is where we can expect the sellers to step in with a defined risk above the resistance to position for a drop into the 4,000 level. The buyers, on the other hand, will look for a break higher to pile in for a rally into the 4,700 resistance next.
We can also see that we have a minor upward trendline defining the recent pullback. We can expect the buyers to lean on it to keep pushing into new highs, while the sellers will look for a break to increase the bearish bets into new lows. The red lines define the average daily range for today.


