
FUNDAMENTAL OVERVIEW
Gold opened lower today following the breakdown of US-Iran negotiations over the weekend. I don’t think anybody sane expected them to reach an agreement on the first round given the strong divergence in proposals.
There have been reports of US and Iran continuing to exchange messages through diplomatic backchannels, but for now we don’t have any official date for another round of negotiations. The good news is that the ceasefire seems to be holding, but Trump decided to put pressure on Iran by blockading their ports.
This has raised the risk of another escalation and the resumption of the war which is going to keep markets on edge. In the meantime, the hawkish bets on central banks returned and that is weighing on gold prices. The price action might remain mostly rangebound until we get some new catalyst.
GOLD TECHNICAL ANALYSIS – DAILY TIMEFRAME
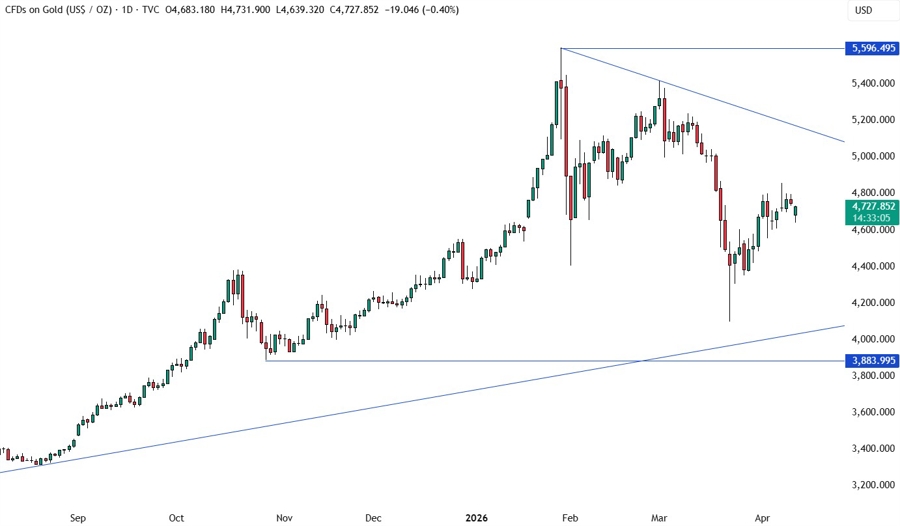
On the daily chart, we can see that gold is consolidating below the 4,800 level. The only clear resistance we have here is the trendline around the 5,000 level. If the price gets there, we can expect the sellers to step in with a defined risk above the trendline to position for a drop into the major upward trendline. The buyers, on the other hand, will look for a break to increase the bullish bets into new highs.
GOLD TECHNICAL ANALYSIS – 4 HOUR TIMEFRAME
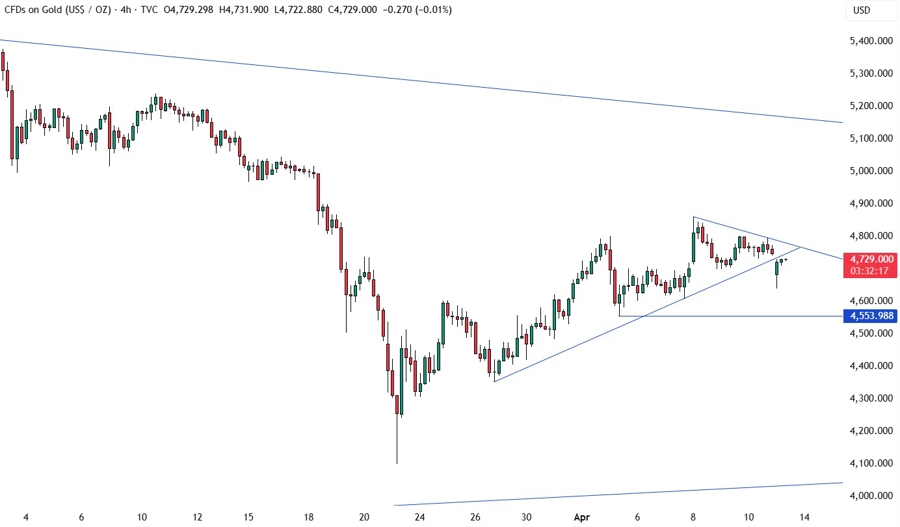
On the 4 hour chart, the price broke below the upward trendline that was defining the bullish momentum. We have now a downward trendline defining the pullback. We can expect the sellers to step in around these levels with a defined risk above the downward trendline to extend the pullback into the 4,553 level. The buyers, on the other hand, will look for a break above the downward trendline to pile in for a rally into the 5,000 level next.
GOLD TECHNICAL ANALYSIS – 1 HOUR TIMEFRAME
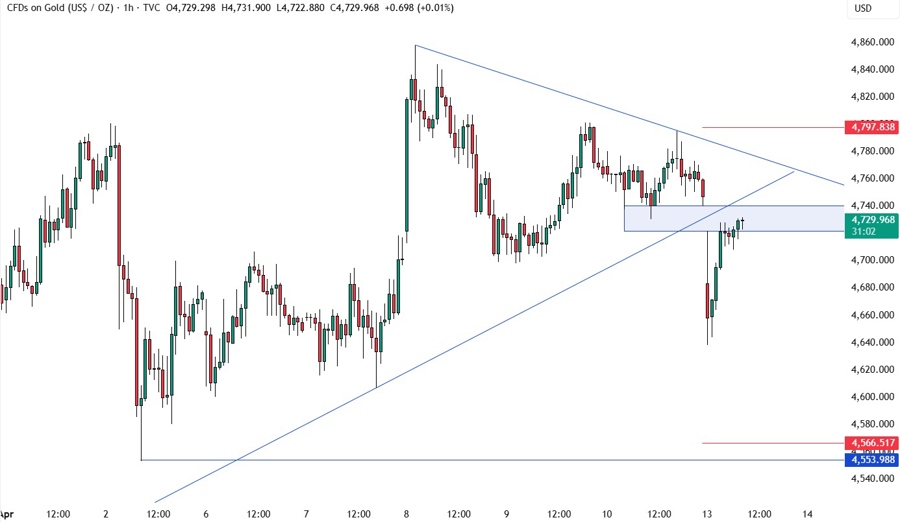
On the 1 hour chart, the price filled the gap which is now acting as resistance. This is where we can expect the sellers to step in with a defined risk above the downward trendline in case the price extends above the resistance. The buyers, on the other hand, will look for a break above the downward trendline to gain more conviction and target new highs. The red lines define the average daily range for today.
UPCOMING CATALYSTS
Tomorrow we have the US PPI report. On Thursday, we get the latest US Jobless Claims figures. The focus remains on US-Iran headlines.


