
FUNDAMENTAL OVERVIEW
Gold broke out of its range on Wednesday as sentiment improved after Trump said on Tuesday that “the war could be over soon.” That prompted traders to scale back hawkish interest-rate expectations, which in turn put pressure on Treasury yields and the US dollar.
However, the positive mood didn’t last long. Gold quickly fell back into the range after reports that US intelligence had detected signs Iran might be deploying mines in the Strait of Hormuz. Oil prices began rising again, and the hawkish bets returned.
Yesterday, Trump told Axios that there’s practically nothing left to target in Iran and that the war will end soon. Unfortunately, the market no longer seems to be buying the “war ending soon” narrative. His comments were largely ignored, as traders now want to see a clear and definitive end to the conflict.
In the short term, the relief from a definitive de-escalation should be positive for gold, since expectations for rate cuts would likely return. What happens next, however, will largely depend on upcoming US data.
If the data starts to show signs of weakness, the market will probably increase the bets on rate cuts, which should push gold to new highs. On the other hand, if the data continues to come in strong, gold will likely stay rangebound or potentially move lower.
GOLD TECHNICAL ANALYSIS – DAILY TIMEFRAME
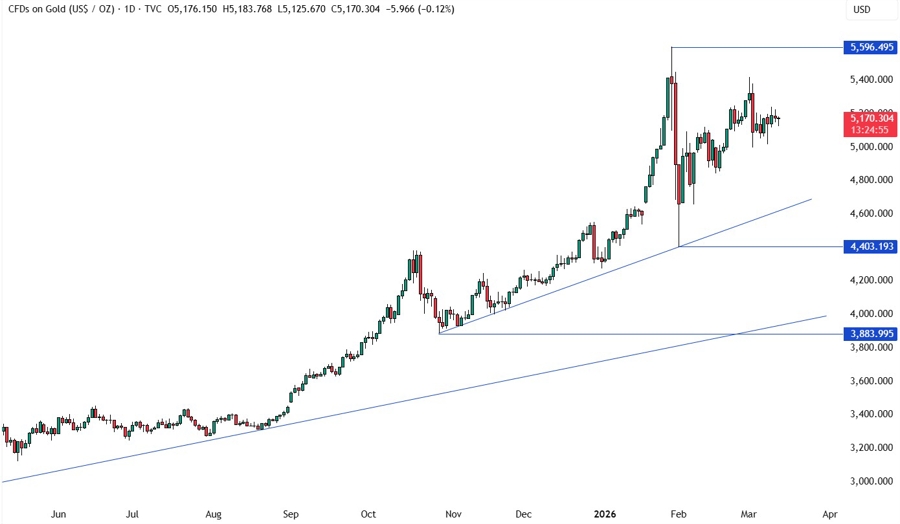
On the daily chart, we can see that gold has been consolidating around the 5,100 level with traders awaiting new catalysts for the next direction. There’s not much we can glean from this timeframe, so we need to zoom in to see some more details.
GOLD TECHNICAL ANALYSIS – 4 HOUR TIMEFRAME
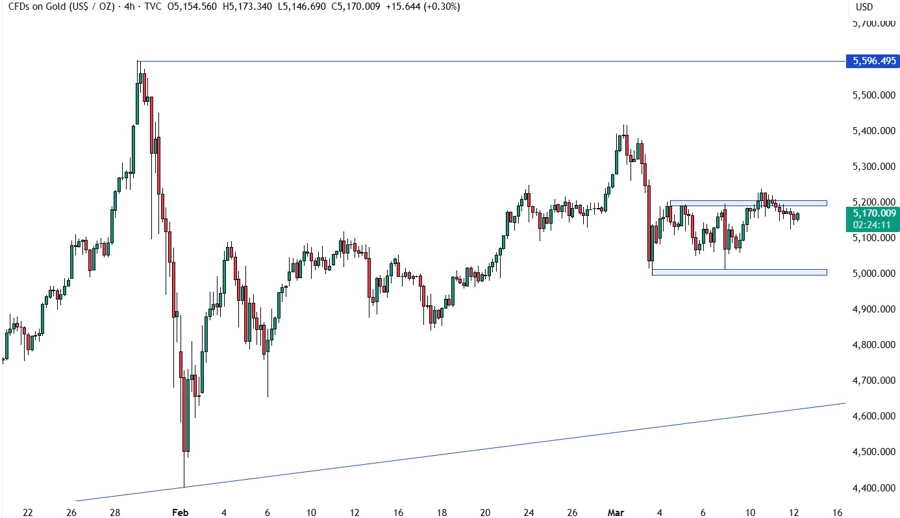
On the 4 hour chart, we can see more clearly the consolidation between the 5,000 support and the 5,200 resistance. The price briefly probed above the resistance but eventually returned inside the range. The market participants will continue to play the range by buying at support and selling at resistance until we get a breakout on either side.
GOLD TECHNICAL ANALYSIS – 1 HOUR TIMEFRAME
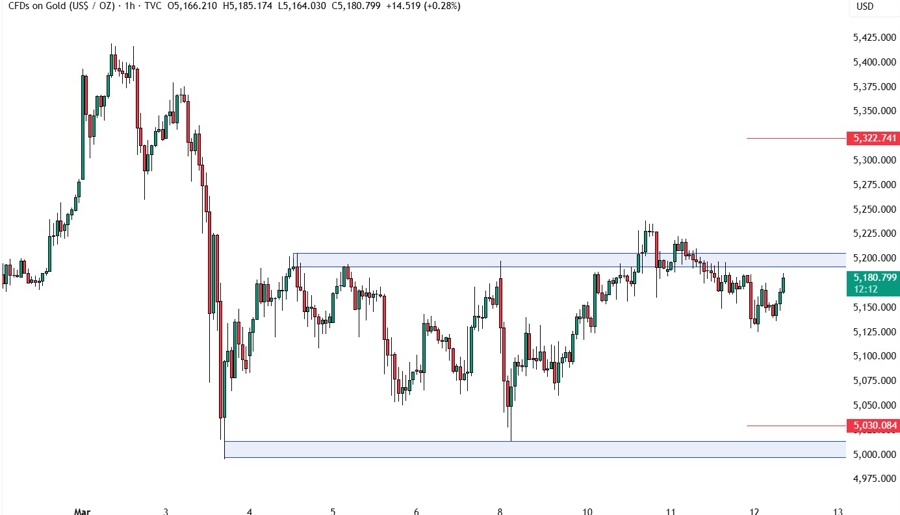
On the 1 hour chart, there’s not much we can add here as the sellers will likely step in around the resistance with a defined risk above it to keep targeting the support, while the buyers will look for a breakout to pile in for a rally into new highs. The red lines define the average daily range for today.
UPCOMING CATALYSTS
Today we get the latest US Jobless Claims figures. Tomorrow, we conclude the week with the US PCE price index, the University of Michigan Consumer Sentiment survey and the Job Openings data. As a reminder, the market focus right now is solely on the US-Iran war, so the data might not matter much.
