
FUNDAMENTAL OVERVIEW
Yesterday, out of the blue, we got a quick selloff in gold without any clear catalyst. The curious thing is that we saw the same price action across many other assets around the same time. It’s unclear what triggered those moves.
Anyway, the focus now is on the US CPI report today. The market is pricing 58 bps of easing for the Fed this year, so there’s a high risk of a hawkish repricing in case the data comes out strong. In such a scenario, we will likely see gold selling off again and potentially reaching new lows.
On the other hand, a soft report shouldn’t change much in terms of near-term Fed policy, but it will keep the dovish bets in place which should act as support for gold.
GOLD TECHNICAL ANALYSIS – DAILY TIMEFRAME
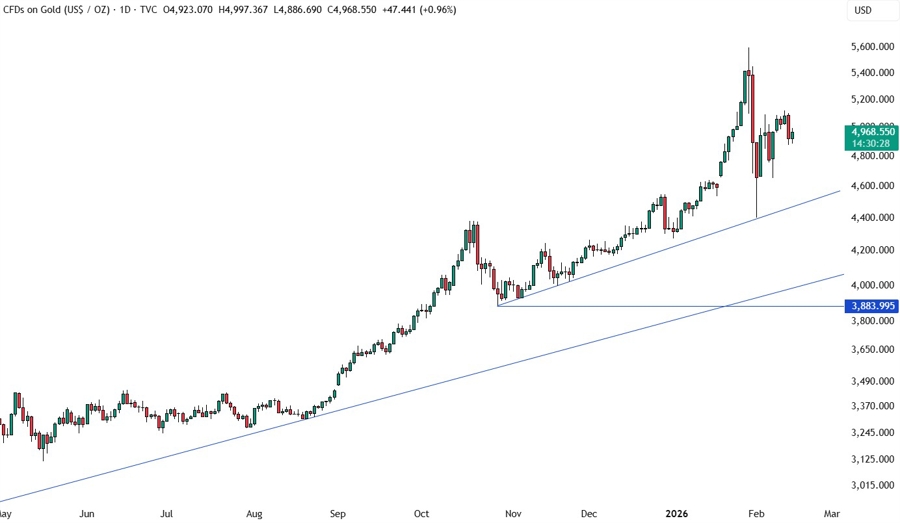
On the daily chart, we can see that gold is trading right in the middle between the all-time highs and the trendline. From a risk management perspective, the buyers will have a better risk to reward setup around the trendline to target new all-time highs, while the sellers will look for a break lower to extend the drop into the 4000 level next.
GOLD TECHNICAL ANALYSIS – 4 HOUR TIMEFRAME
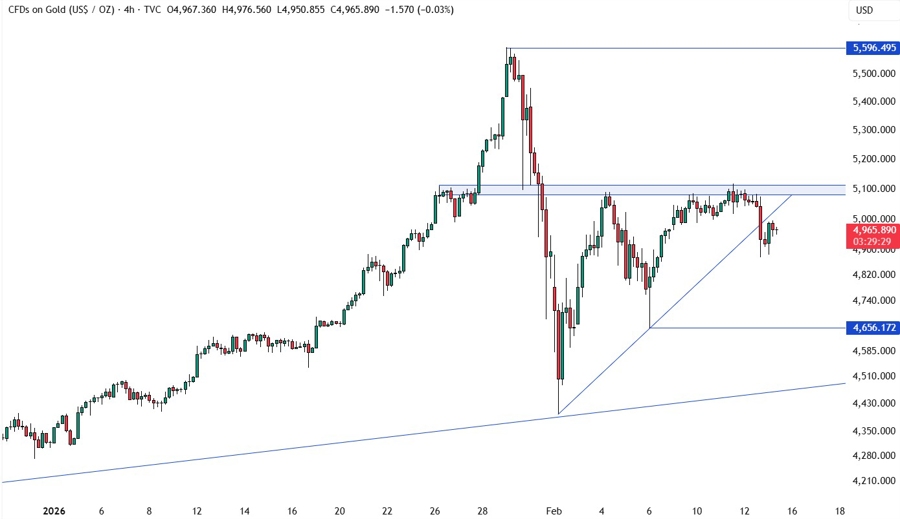
On the 4 hour chart, we can see a strong resistance around the 5100 level where the price got rejected from several times in the past weeks. We got a break below the upward trendline yesterday which could be a signal of more downside to come.
The sellers piled in on the break to target the 4656 level but if we get a retest of the broken trendline, the sellers will likely step in again near the resistance with a defined risk above it to position for a drop into new lows. The buyers, on the other hand, will want to see the price breaking above the resistance to pile in for a rally into new all-time highs.
GOLD TECHNICAL ANALYSIS – 1 HOUR TIMEFRAME
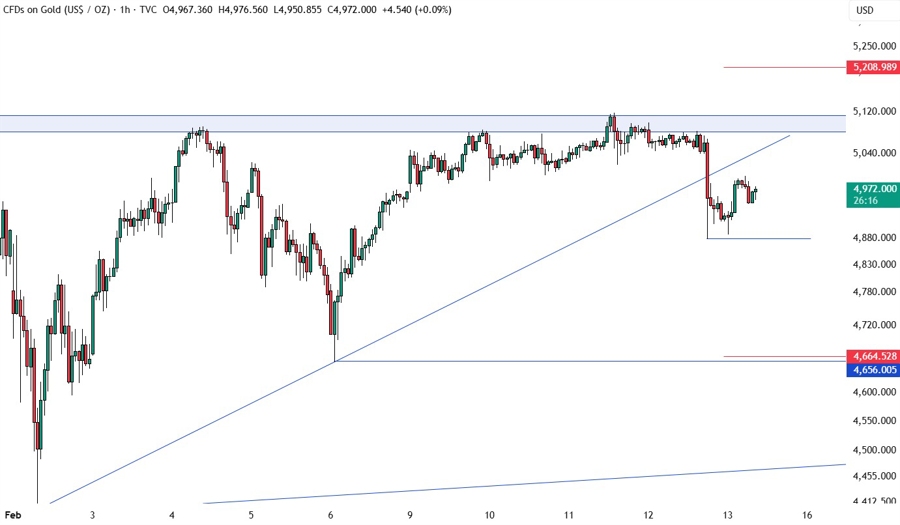
On the 1 hour chart, there’s not much else we can add but if the price were to fall below the recent low at 4878, we can expect the bearish momentum to increase as more sellers will likely pile into the selloff. Watch out for the US CPI report today as it could trigger big moves in the market. The red lines define the average daily range for today.
UPCOMING CATALYSTS
Today we conclude the week with the US CPI report.


