
FUNDAMENTAL OVERVIEW
Oil prices rose back to the weekly highs after Trump disappointed the market in today’s speech. Earlier in the week, crude oil came under pressure after Trump basically confirmed the WSJ report in a Truth Social post that he would be open to end the war with Iran without the Strait of Hormuz opening condition. Later that day we also had Iranian President saying that they were ready to end the war but wanted guarantees.
It looks like the market wrongly ignored yesterday’s news though. In fact, Trump posted this on his Truth Social:
“Iran’s New Regime President, much less Radicalized and far more intelligent than his predecessors, has just asked the United States of America for a CEASEFIRE! We will consider when Hormuz Strait is open, free, and clear. Until then, we are blasting Iran into oblivion or, as they say, back to the Stone Ages!!! President DJT”
Trump self-imposed a 5-day ceasefire last week, then extended it by another 10 days (set to expire on April 6). At the same time, he made it clear that any ceasefire would depend on reopening the Strait, despite having downplayed that condition just a day earlier. He also ended his message with the usual threats.
Moreover, the White House indicated ahead of the speech that Trump would reiterate a 2–3 week timeline for ending the war. That stretches well beyond the current ceasefire window, leaving plenty of room for tensions to escalate again. This should keep oil prices supported (all else being equal).
CRUDE OIL TECHNICAL ANALYSIS – DAILY TIMEFRAME
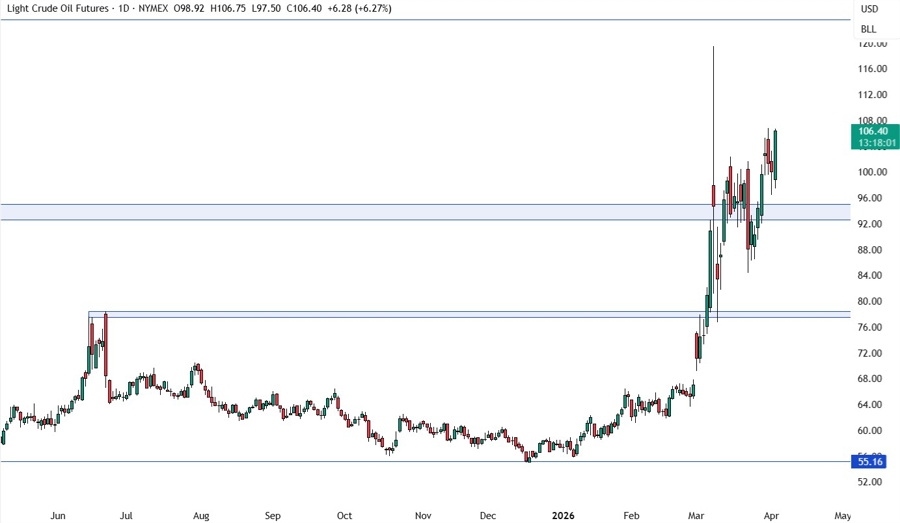
On the daily chart, we can see that crude oil recovered the losses and it’s now trading near the weekly highs. If the price pulls all the way back to the 93.00 zone, we can expect the buyers to step in with a defined risk below the zone to position for a rally into new highs. The sellers, on the other hand, will look for a break to pile in for a drop into the 78.00 support next.
CRUDE OIL TECHNICAL ANALYSIS – 4 HOUR TIMEFRAME
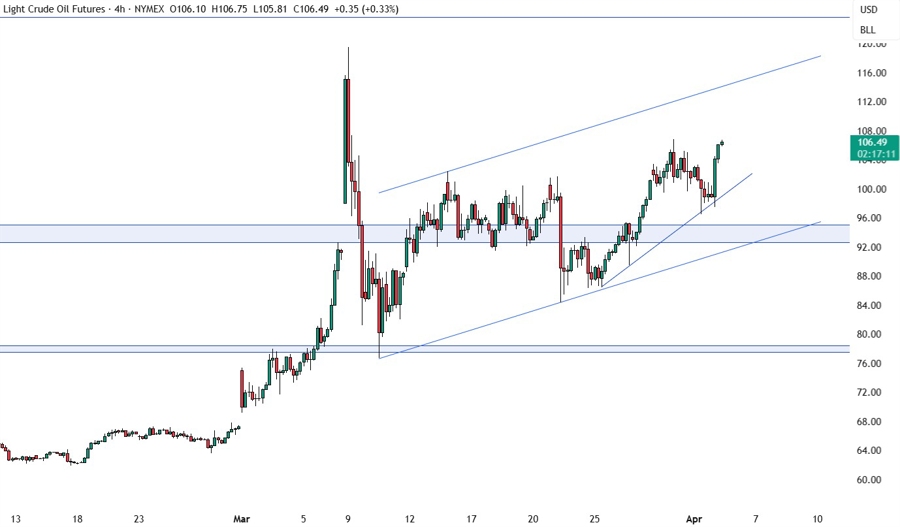
On the 4 hour chart, we can see the price bounced on the minor trendline. The natural target should be the upper bound of the potential rising channel. If we get another pullback, we can expect the buyers to continue to lean on the trendline to keep pushing into new highs, while the sellers will look for a break lower to pile in for a drop into the lower bound of the channel.
CRUDE OIL TECHNICAL ANALYSIS – 1 HOUR TIMEFRAME
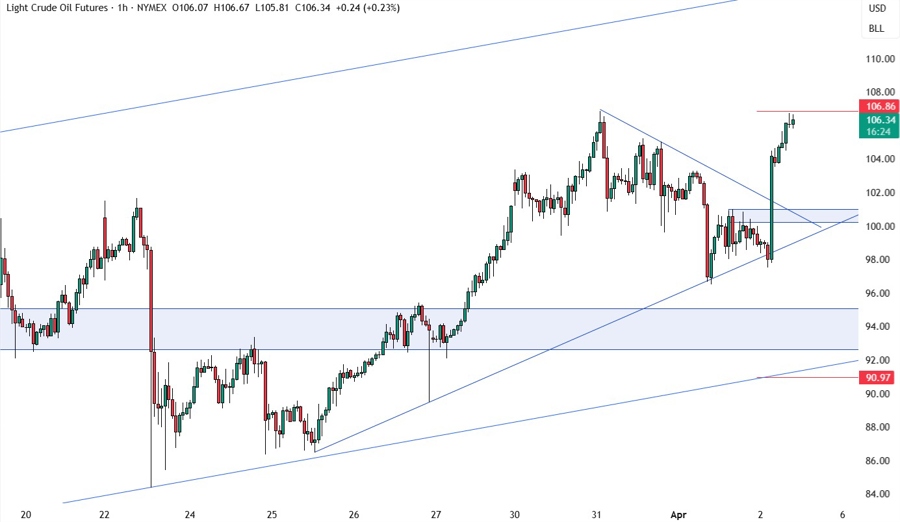
On the 1 hour chart, we can see the buyers increased the bullish bets into new highs after the break above the downward trendline. Again, if we get a pullback into the upward trendline we can expect the buyers to step back in around the 100.00 support. We can also notice that the price is currently trading at the upper bound of the average daily range for today. In such instances, we can generally see a pullback or some consolidation before the next move.
UPCOMING CATALYSTS
Today we get the latest US Jobless Claims figures. Tomorrow, we conclude the week with the US NFP report.


