
FUNDAMENTAL OVERVIEW
After some weakness following the US capture of President Maduro, crude oil rose to new highs as the market focus switched quickly from Venezuela to Iran.
The protests in Iran represent one of the most significant challenges to the Islamic Republic's authority in decades. The unrest was ignited by a catastrophic currency collapse, with the rial plummeting to over 1.4 million per USD, and a sharp hike in fuel prices. However, the protests quickly evolved into a broad rejection of the leadership.
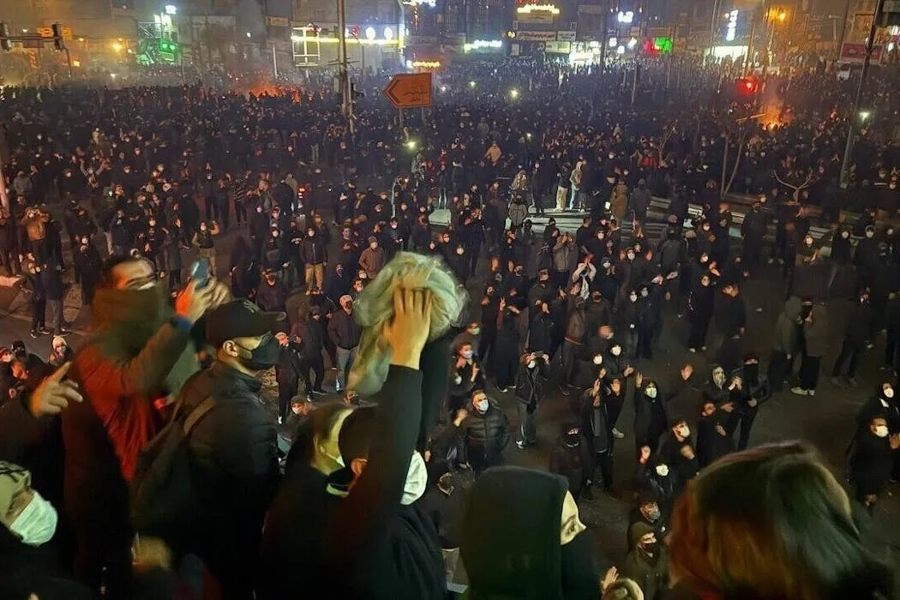
The government has labelled protesters as "terrorists" and "rioters" backed by the U.S. and Israel. President Trump has shown support to the protesters and even weighed a potential military intervention. The US is taking advantage of the protests to weaken the Iranian regime and force it to comply with US’s requests. According to Trump and other US officials, Iran has already got in touch with the US to negotiate.
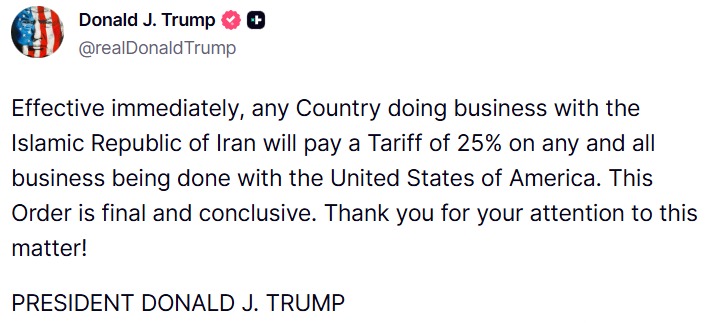
Yesterday, Trump stated on his social media that any country doing business with Iran would get a 25% tariff. Given the risks of military escalation, crude oil prices continued to rise on an increase in the geopolitical risk premium. If we get to an actual intervention, prices could surge meaningfully, while positive negotiations will likely erase the recent gains.
As a reminder, we had also the OPEC+ meeting this month, but that went as expected with the cartel maintaining output steady throughout Q1 2026.
On the demand side, despite global monetary easing and improving economic conditions, the oil market remained weak, potentially due to output hikes from OPEC+. The bearish positioning is very stretched though, so we might see some life in the market this year if economic activity strengthens further and OPEC+ keeps output steady.
CRUDE OIL TECHNICAL ANALYSIS – DAILY TIMEFRAME
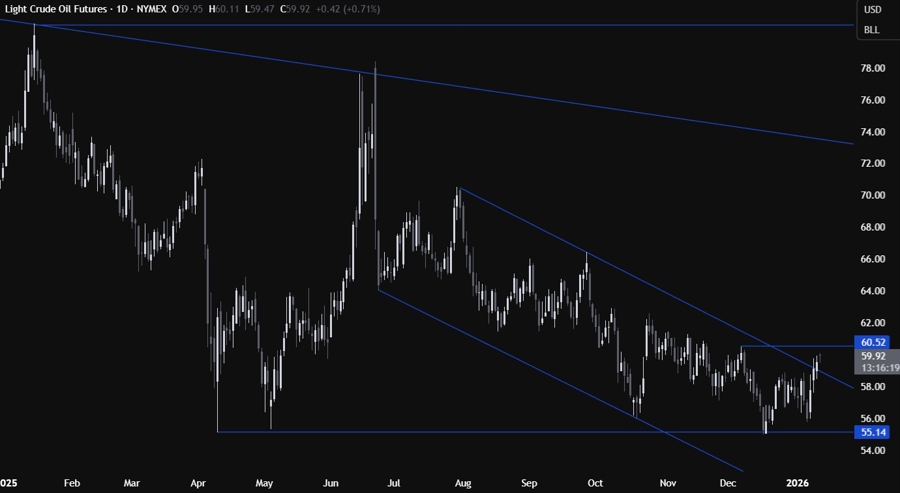
On the daily chart, we can see that crude oil is breaking above the upper bound of the falling channel. The buyers are piling in with a defined risk below the trendline and will need a break above the 60.52 swing level to open the door for a move into the 66.00 level next. The sellers, on the other hand, will likely step in around the 60.52 level to position for a drop back into the 55.00 handle.
CRUDE OIL TECHNICAL ANALYSIS – 4 HOUR TIMEFRAME
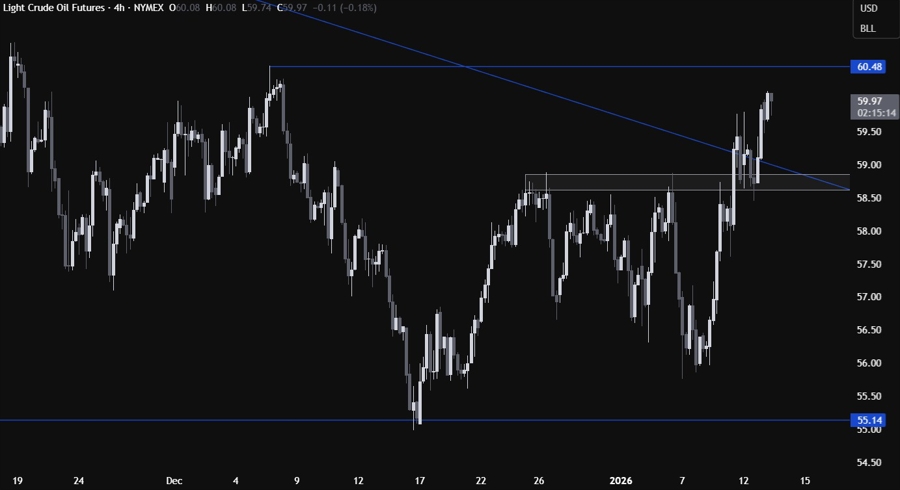
On the 4 hour chart, we can see that we have a strong support zone around the 58.70 level. If we get a pullback into the support, we can expect the buyers to step in with a defined risk below the support to position for a rally into the 66.00 handle. The sellers, on the other hand, will want to see the price breaking lower to increase the bearish bets into the 55.00 level next.
CRUDE OIL TECHNICAL ANALYSIS – 1 HOUR TIMEFRAME
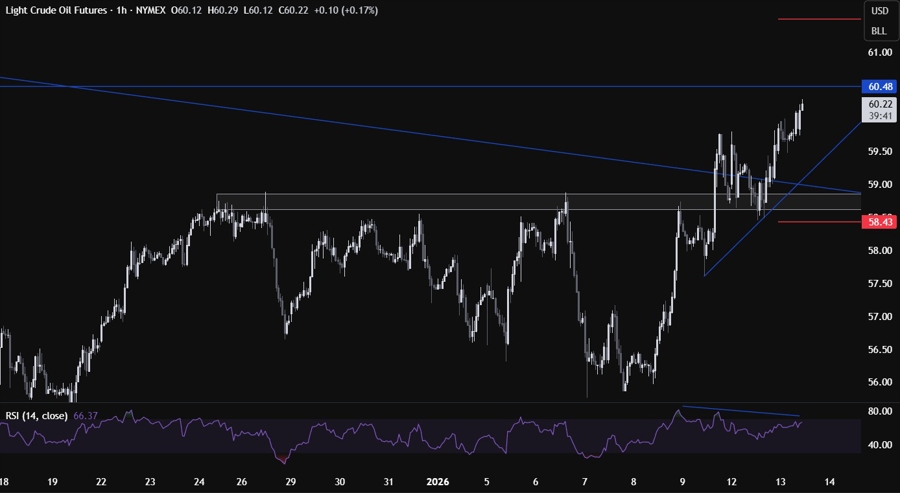
On the 1 hour chart, we can see that we have a minor upward trendline defining the bullish momentum on this timeframe. We can also notice that the momentum into the 60.50 level is waning as depicted by the divergence with the RSI.
If we get a pullback into the trendline, we can expect the buyers to lean on it to keep pushing into new highs, while the sellers will need to see a break below the trendline and the support to gain more conviction for further downside. The red lines define the average daily range for today.
UPCOMING CATALYSTS
Today we have the US CPI report. Tomorrow, we get the November US Retail Sales and US PPI reports, so it’s going to be old data. We also have a potential US Supreme Court decision on Trump’s tariffs tomorrow. On Thursday, we get the latest US Jobless Claims figures.
