
Key Points for crude oil traders and investors:
Crude oil futures have broken out of a classic daily bull flag pattern.
The $65 area on crude is now a key line that separates strength from failure.
UCO is forming higher lows near $25, showing buyers are stepping in on dips.
As long as support holds, the short term bias remains constructive.

Energy has quietly started to attract attention again. While parts of the growth trade are cooling off, I’ve noticed steady rotation into oil. The daily chart of Crude Oil futures (CL1!) now reflects that shift with a clean technical breakout that beginners can understand.
Let’s break it down in simple terms.
Commodity markets are experiencing heightened volatility driven by escalating Middle East tensions and shifting supply dynamics. Geopolitical risks have taken center stage following reports that President Trump is considering an initial, limited military strike on Iran to pressure Tehran into halting uranium enrichment and accepting a new nuclear deal. In response, Iran warned the UN of a "decisive response" against all bases and assets of any hostile force if subjected to military aggression, significantly elevating the threat of a broader regional conflict. These mounting war fears triggered an immediate reaction in the energy sector, pushing WTI crude oil to break out and settle at its highest level since August.
This bullish momentum in the oil market was further solidified by an unexpected supply crunch, as the latest EIA report revealed a massive crude oil inventory draw of over 9 million barrels, drastically defying expectations of a 2.1 million barrel build. Amidst this geopolitical uncertainty and a shifting macroeconomic backdrop, safe-haven assets are also commanding long-term confidence. Highlighting the structural bid for precious metals, Goldman Sachs expects gold to steadily grind higher to $5,400 per ounce by the end of 2026, a forecast driven by persistent central bank purchases and a cyclical pickup in private investor demand tied to the Federal Reserve's rate easing cycle
The Big Picture in Crude Oil Technical Analysis: Crude Oil’s Daily Bull Flag
On the daily chart, crude oil first made a strong rally. After that move, price didn’t collapse. Instead, it drifted lower inside a controlled downward channel. That type of pause after a rally is called a bull flag.
Why does that matter for oil traders?
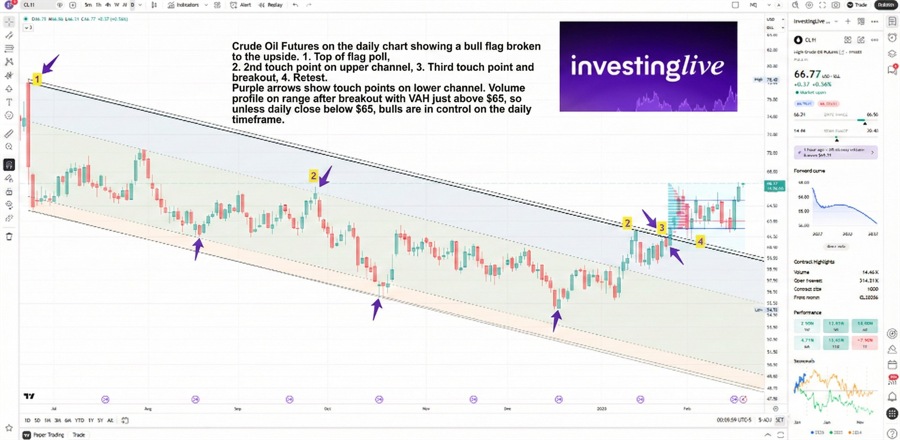
Because bull flags often act as continuation patterns. It means the market is resting, not reversing.
Here is what happened step by step:
The Breakout: Buyers pushed price above the top of the downward channel. That was the first signal momentum was shifting.
The Retest: Price then pulled back to test that breakout area. Instead of falling apart, it held. That’s important. Former resistance acting as support is a healthy technical sign.
Right now, the key level on crude futures sits just above $65.
If crude continues to close daily above $65, the breakout structure remains valid.
If price closes back below $65, the move risks turning into a failed breakout.
That’s the simple framework.
What UCO Is Showing Beneath the Surface
For traders who use ETFs instead of futures, the ProShares Ultra Bloomberg Crude Oil ETF (UCO) offers another clue.
UCO is trading around $25, and its behavior has changed.
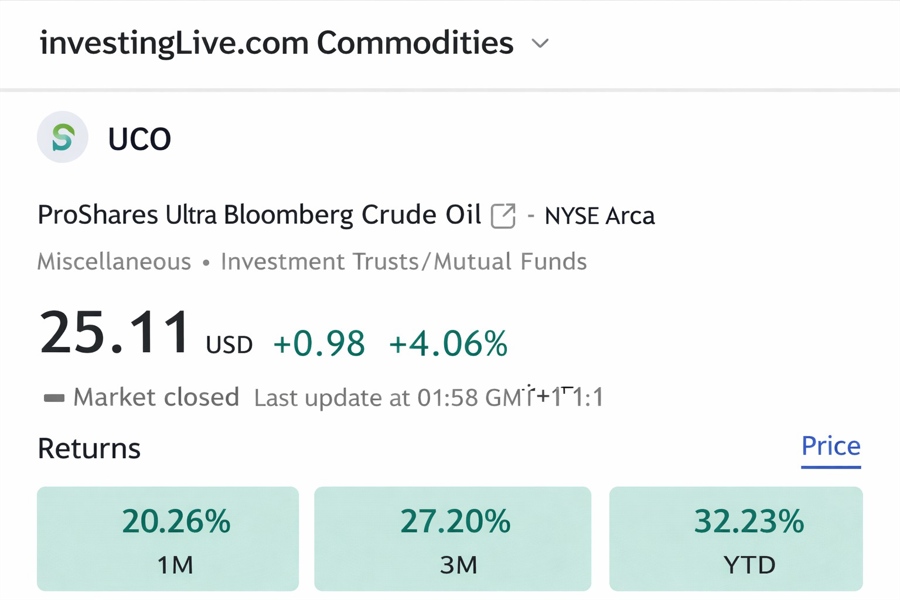
Previously, when price dipped, sellers pushed it lower easily. That dynamic is fading. Now, dips are being absorbed faster. Sellers are struggling to extend moves down. At the same time, higher prices are being accepted rather than immediately rejected.
Technically, UCO is forming a sequence of higher lows. That is a simple but powerful sign that buyers are gradually gaining control.
Two tactical zones matter:
Resistance: $25.20 to $25.50
If price accepts above this zone, continuation toward higher levels becomes more likely.Support: $24.40 to $24.60
As long as price holds above this band, the short term constructive structure stays intact.
A sustained break below $24.40 would weaken the current thesis.
How to Think About This as a New Oil Trader
Instead of thinking “oil is going up,” or "is entering a Long on oil now too late?", then consider to frame it like this:
If crude stays above $65 and UCO holds above $24.40, the technical structure supports continuation.
If those levels fail, the breakout scenario weakens and risk increases.
That is how experienced traders manage uncertainty. We do not predict. We react to levels.
At this stage, the overall read is moderately bullish, but conditional. And entry now is not early, so that influences the 'moderately' part. Still, oil is showing improving demand characteristics, yet it still needs to prove it can sustain above key thresholds. Technically, it might also decline for another retest on the bull flag shown above (and if it does so, it would be crossing down the Value Area High and the important $65 mark on Crude Oil Futures... Remember to watch that).
This analysis is for educational and decision support purposes only. Markets are volatile and trading involves risk.


