
KEY POINTS:
- Gold remains supported amid geopolitical tensions and weak US data
- Risks in the short-term include the US NFP report on Friday and potential US Supreme Court decision on tariffs
- Big picture uptrend should remain intact amid the Fed's dovish reaction function
FUNDAMENTAL OVERVIEW
Gold continues to be supported by the geopolitical tensions and the weak US data. The bullish momentum for now remains intact but the US NFP report on Friday could challenge that.
In fact, while the previous report might have been taken with a pinch of salt due to shutdown related issues, this one should give us a clearer picture. Strong data might lead to a bigger pullback as traders push back on expectations of an imminent Fed rate cut, while soft figures should keep on supporting the upside.
Moreover, yesterday the US Supreme Court scheduled Friday as an opinion day, which could see a decision on Trump’s tariffs. In case the tariffs are struck down, gold will likely fall amid easing stagflation risks. On the other hand, if tariffs are kept in place, it shouldn’t change much although it would keep the upside intact.
In the bigger picture, gold should remain in an uptrend as real yields will likely continue to fall amid the Fed’s dovish reaction function. But in the short term, a hawkish repricing in interest rate expectations could weigh on the market.
GOLD TECHNICAL ANALYSIS – DAILY TIMEFRAME
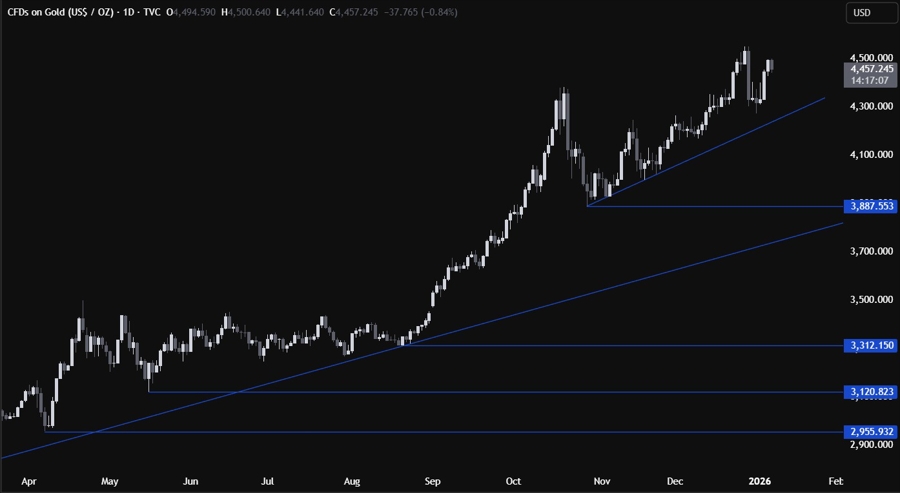
On the daily chart, we can see that gold recovered almost all the losses from last week’s selloff. Nevertheless, from a risk management perspective, the buyers will have a better risk to reward setup around the trendline to position for a rally into a new all-time high. The sellers, on the other hand, will want to see the price breaking lower to pile in for a drop into the 3887 level next.
GOLD TECHNICAL ANALYSIS – 4 HOUR TIMEFRAME
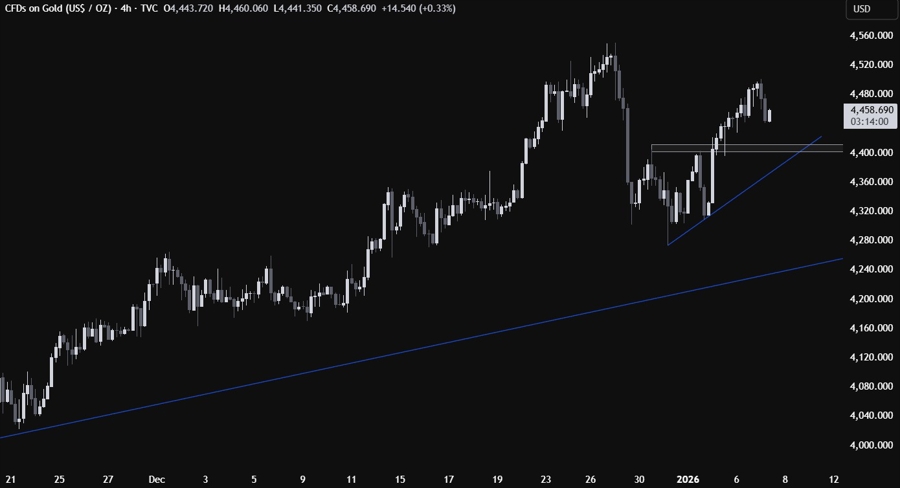
On the 4 hour chart, we can see that we have a minor support zone around the 4400 level. If we get a pullback, the buyers will likely step in around the support with a defined risk below the minor trendline to position for a rally into new all-time highs. The sellers, on the other hand, will want to see the price breaking lower to pile in for a drop into the major trendline.
GOLD TECHNICAL ANALYSIS – 1 HOUR TIMEFRAME
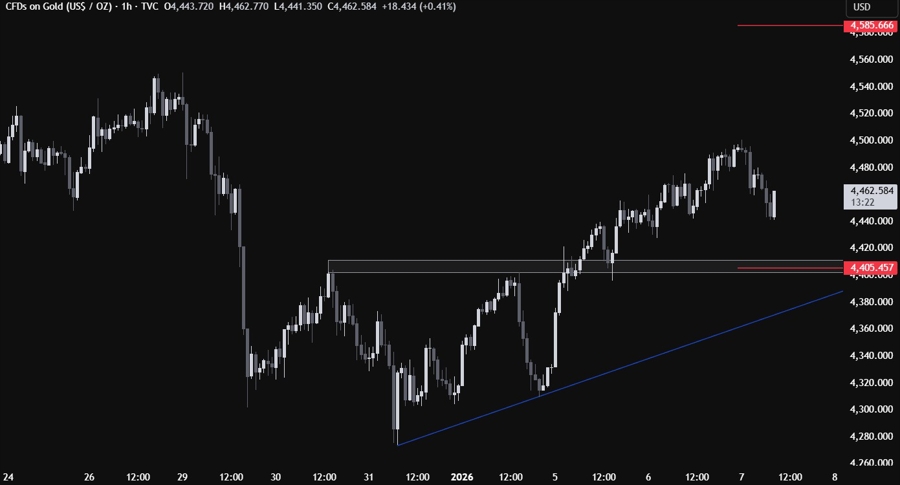
On the 1 hour chart, we can see that we have the lower bound of the average daily range for today standing right around the support. This should give the buyers more conviction to pile in around the support in case we get a pullback into it. The sellers, on the other hand, will need a break below the trendline to open the door for a bigger pullback into the major trendline.
UPCOMING CATALYSTS
Today we have the US ADP, the US ISM Services PMI and the US Job Openings data. Tomorrow, we get the latest US Jobless Claims figures. On Friday, we conclude the week with the US NFP report and potential US Supreme Court decision on Trump’s tariffs.
