
FUNDAMENTAL OVERVIEW
Gold is now consolidating between major technical levels as traders await new catalysts before picking a direction. The fundamentals are still against rising prices, so we either get stuck in a wide range below the January’s high or will see another flush lower in the next weeks or months.
Next week is going to be a big one for precious metals. In fact, we will get the US NFP report on Wednesday and the US CPI on Friday. Strong data is going to trigger a hawkish repricing in interest rate expectations and likely push gold into new lows. Soft data, on the other hand, should support the market amid Fed’s rate cut bets.
GOLD TECHNICAL ANALYSIS – DAILY TIMEFRAME
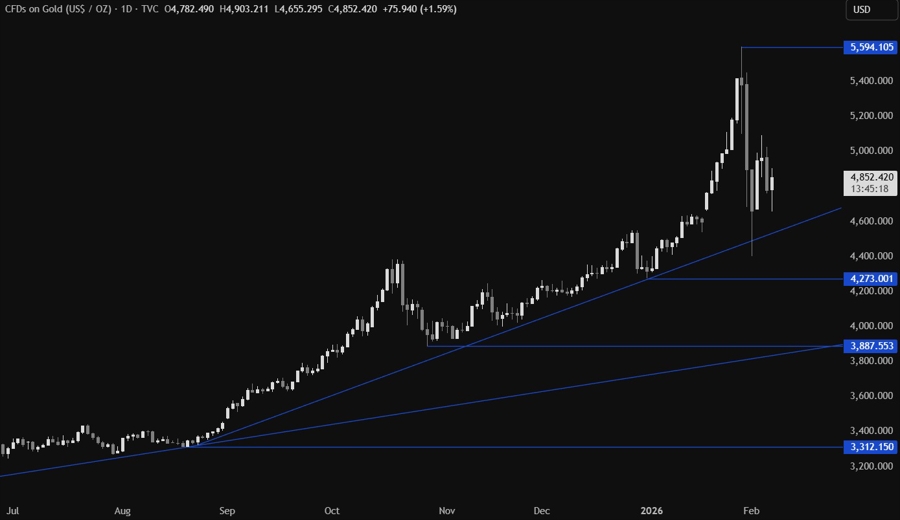
On the daily chart, we can see that gold is now consolidating above the trendline as traders await new catalysts for the next major move. If we get another flush into the trendline, we can expect the buyers to step in with a defined risk below it to position for a rally into a new record high. The sellers, on the other hand, will look for a break lower to increase the bearish bets into the 4273 level next.
GOLD TECHNICAL ANALYSIS – 4 HOUR TIMEFRAME
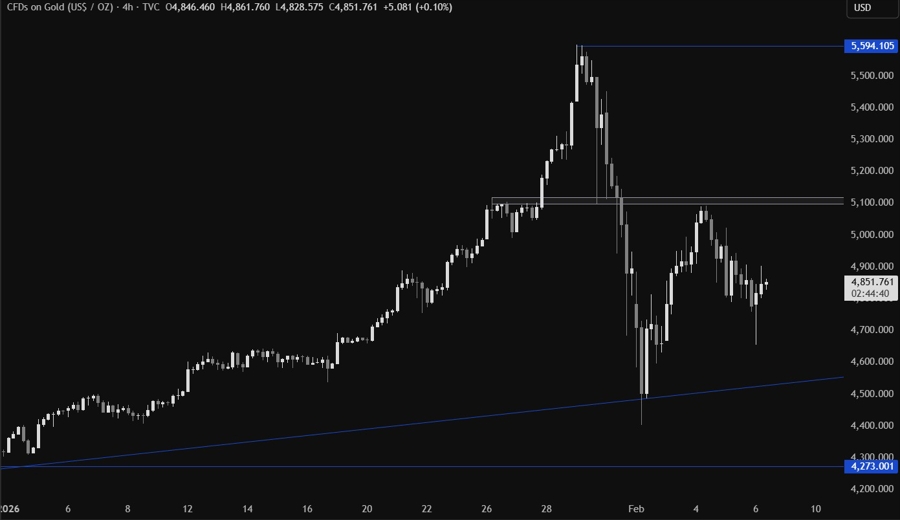
On the 4 hour chart, we can see that we have a resistance zone around the 5100 level where we eventually got the rejection. If the price rallies back into it, we can expect the sellers to step in again with a defined risk above the resistance to position for a drop into the trendline targeting a breakout. The buyers, on the other hand, will look for a break higher to pile in for a rally into new all-time highs.
GOLD TECHNICAL ANALYSIS – 1 HOUR TIMEFRAME
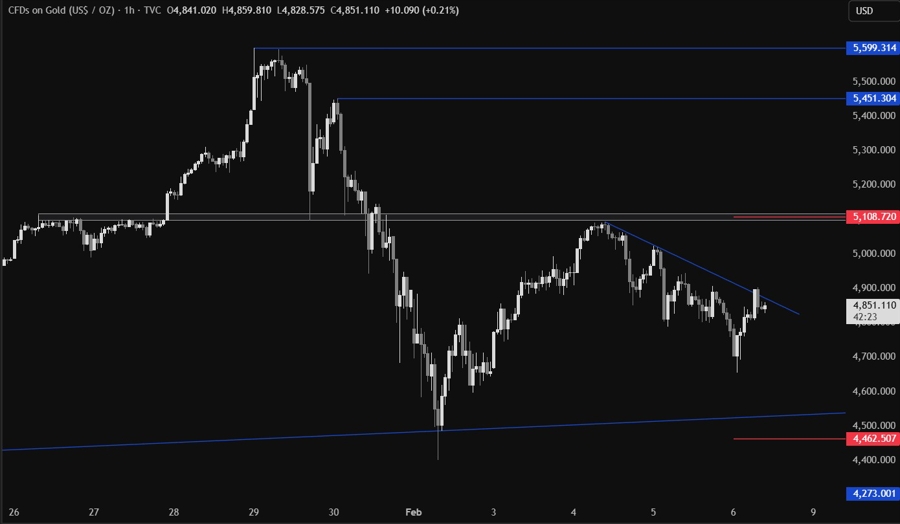
On the 1 hour chart, we can see that we have a minor downward trendline defining the bearish momentum on this timeframe. The sellers will likely continue to lean on the trendline with a defined risk above it to keep pushing into new lows, while the buyers will look for a break higher to target the 5100 resistance. The red lines define the average daily range for today.
UPCOMING CATALYSTS
Today we conclude the week with the University of Michigan Consumer Sentiment data.


