Why we use time frames in technical analysis
It is great to see the volatility pick up in the forex market as per Adam’s post. There are many who complain about how the Big Boys push the market around and increase volatility, but quite frankly, it beats the quagmire we were stuck in for most of the 2014 trading year.
A measure of volatility I like to look at is the simple 22 day average trading range. To calculate I just subtract the high from the low to get the trading range for the day, and average the last 22 days values to get the 22 day average.
Why 22 days? Because in my simple mind, I take 4 weeks in a month. That is 20 business days (4 x 5 days a week) and add two for the extra couple days in the month. I arrive at a benchmark for what the average low to high trading range is for a running month of trading.
What can I do with that?
I use the 22 day average trading range as an aid for getting a feel for whether a day may have exhausted itself out (i.e. may have gone too far and will likely correct), or – on the other extreme – not gone far enough. In which case there may be more “room to roam”.
If I can anticipate a exhaustion, or an acceleration (i.e. extension) that gives me a trading advantage the “Average Joe” does not have. Note it does not guarantee success, but it gives me an edge.
I can then focus on price action with the added dimension as a filter. Let me explain what I mean through an example from last week’s trading.

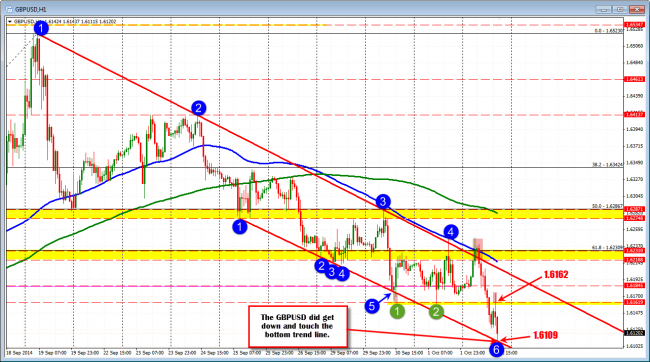
GBPUSD falls to trend line support.
On Thursday,the GBPUSD was testing a lower trend line (see blue circle 6 in the chart above). It was a key technical level that had a number of tests (SEE POST HERE). I wrote at the time:
The range for the day is now 136 pips. The average trading range is 109 pips over the last 22 trading days. So we have a pretty good day so far. Is the low in place for the day? Intraday traders can lean against the level now with risk defined and limited.
Reading between the lines, I was REALLY saying
We are at a good support level. The GBPUSD is now 27 pips above what is average range for the day (which is about 25% above normal). We have unemployment tomorow. We are heading into the afternoon. Maybe it is worth taking profit or trading a counter trend.
If we were not at a technical level, the 136 pips would not have been as significant to me. However, since we were at a support target, it made more sense to me that the level might hold, and the low might be in place for the day.
I got lucky. The price did stall and correct higher.
Although “lucky”, successful traders make their own luck by defining risk and using logic to help put the odds of success more in their favor. The trade was worth a shot – after all, I only had to risk 6-10 pips at the most.
Now what if the range for the day was only 60 pips – not 136 pips – and we were testing the same trend line? Would I be as anxious to buy knowing the 22 day average trading range is 109 pips for the GBPUSD ?
The answer is: No. I would probably not be as anxious (or confident may be a better word).
The simple (logical) reason is the pair had “room to roam” and if the bias is lower, there may be more of a chance that the extension will be to the downside. In fact, I will be thinking that there may up to 49 more pips left in the move lower (109 average trading range – 60 pips actual). So rather than buy against support, I would be more inclined to sell on a break instead, and look for that 40-50 pip extension lower.
If you want a new dimension in your trading, be aware of what is normal for range. If you do, you will start to anticipate tops and bottoms (with limited risk) and have a better idea when it is right to go with a break. Of course, this mainly is relevant in London and NY trading. In Asian trading, it is not relevant.
The below graph below shows the high to low range for the day (blue) and the average trading ranges over the last 22 days for some of the major currency pairs (red bars). I will look to keep you informed of how the ranges are changing on our website. They will increase and decrease as market volatility increases and decreases (mainly from trending markets) but the day to day change is slower.
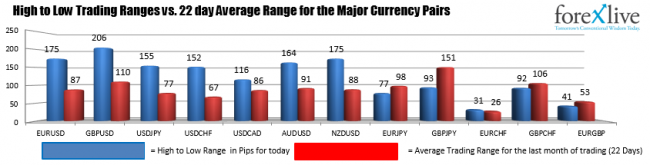
The high to low trading ranges for the day and 22 day average trading ranges.
