
Getting to know Chart Patterns with altFINS

altFINS automatically identifies 16 commonly traded crypto chart patterns, which gives traders timely trading opportunities and saves them time.
This article will provide you with clear steps and important tips on how to best use Chart Patterns for trading, including:
- Which crypto assets are used for pattern recognition?
- Time interval selection
- Best patterns for beginners
- Breakouts vs. Emerging patterns
- Success rates of various patterns
- Profit potential
- Best time to enter a pattern trade
- When to exit a trade
- Aligning with trend
- Risk management
We also recommend you watch an introduction video about using altFINS' Patterns section.
altFINS Patterns section looks like this:
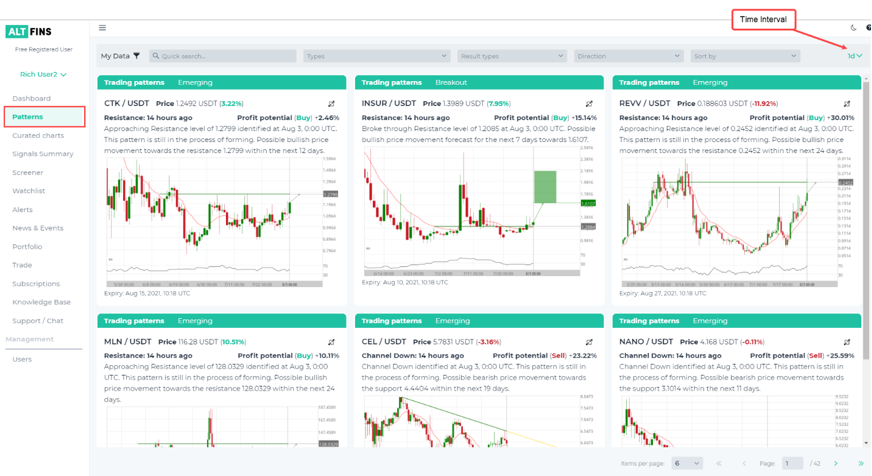
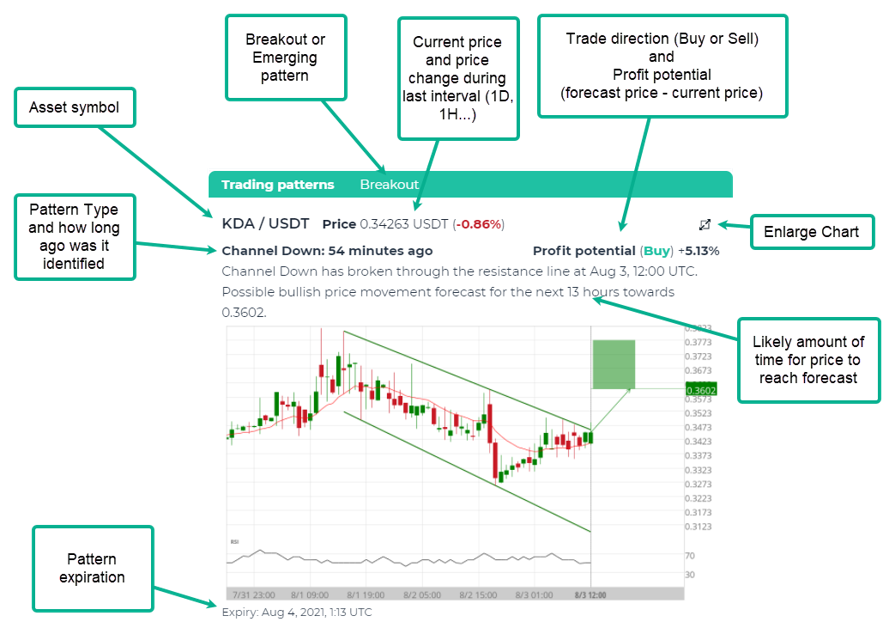
Let's first break down the various components of our pattern charts:
1. Which assets are used for pattern recognition? altFINS analyzes the top 500 coins (by market cap) and this list is updated every quarter.
2. Time interval selection. Patterns are identified over 4 time intervals (1D, 4H, 1H, 15 min). Novice traders should use higher time frames (1D, 4H) while more experienced traders can use lower time frames. It also depends on how much time you have to monitor your positions. Lower time frames (1H, 15 min) require more frequent trade management (monitoring, closing). However, the success rates of the patterns are about the same across these time intervals. So a Horizontal Level Breakout has about the same chance of success on a daily (1D) interval as it does on hourly (1H) interval.
Lower intervals will of course have more patterns forming, more frequently.
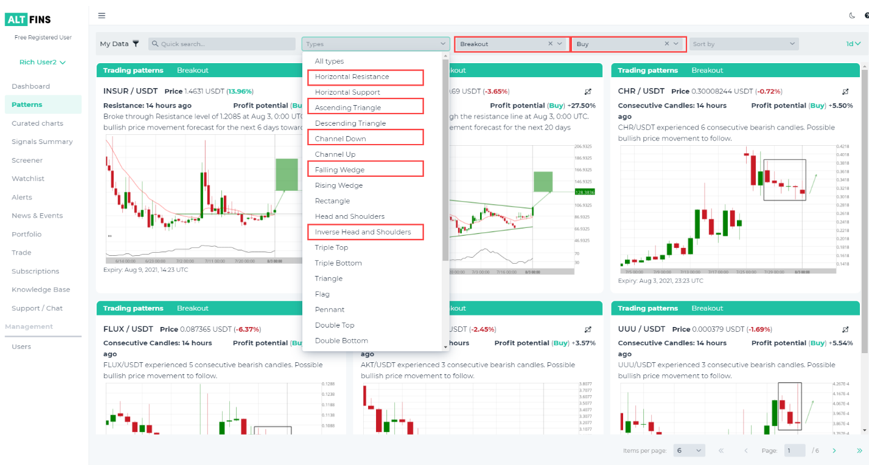
3. Best patterns for beginners. Beginners should stick with the patterns that are easiest to understand and have the highest success rates.
That means: Breakouts (not emerging) + Buy direction + pattern types including Horizontal Resistance, Ascending Triangle, Channel Down, Falling Wedge, Inverse Head and Shoulders. Those patterns tend to have 67-83% success rate (see next section).
4. Breakout vs. Emerging Patterns. Read this article in our knowledge base to understand the difference. Overall, Breakout patterns tend to have higher profit potential and are also better suited for beginner traders and Trend traders, while Emerging patterns are good for more advanced and Swing traders.
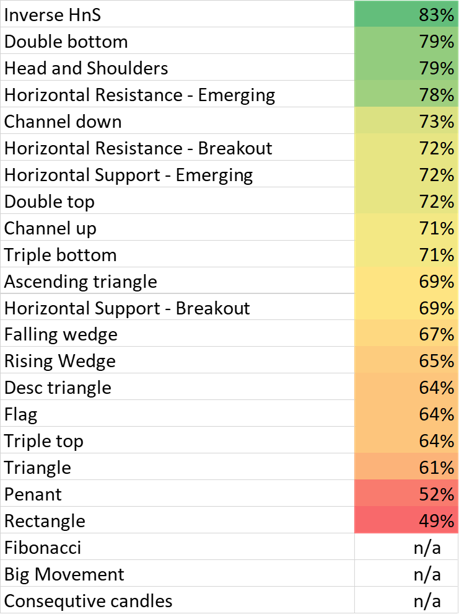
5. Success rates of various patterns. What does "success rate" mean? It means that price achieved the target within one length of the pattern. So if the pattern was detected over 20 days, then the price target had to be achieved in 20 days after identifying the pattern.
Based on historical backtests, the success rates of the patterns on our platform are as follows:
6. Profit potential. altFINS calculates the profit potential for most of the patterns identified. The calculation is simple. It's the distance from current live price and the forecast price.
7. The best time to enter a pattern trade is when it's freshly identified and published on altFINS platform. However, some traders wait for 1-2 candles (1D, 1H...depending on time interval selected) to confirm the price path.
8. When to exit a trade? - when pattern gets removed (becomes inactive). Patterns are removed from our platform when 1) they achieved their forecasted price, 2) after 10 candles have passed (i.e. 10 days, 10 hours...), 3) if price goes too far against the forecasted direction (more than 1 standard deviation=> busted trade).
We recommend 10 candles (days, hours, etc. - depending on time interval used) as the max length of a trade based on historical data, which suggests that forecasted prices are typically reached within 10 candles after identifying a pattern. So if the price has not achieved a forecasted price within 10 candles, trader should close that position.
In the works: in 2H-2021, altFINS will introduce alerts for patterns as well. Traders will get alerts when patterns expire or get removed for any of the above mentioned reasons. You'll also be able receive alerts for coins where we detect new patterns.
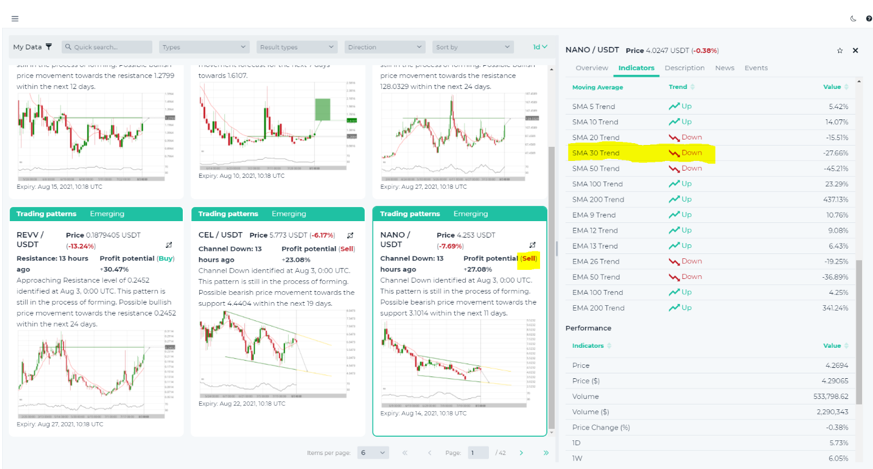
9. Aligning with trend. While this is not an absolute must, it does help increase the success rate. The old adage goes "Trade with trend". That applies to patterns as well. Market trends change and the success rates of Buy vs. Sell trades are greatly influenced by the overall trend direction. Hence, traders should use Buy direction patterns when the trend is Up, and vice versa. How to identify a trend? We recommend using the slope of a 30-period SMA (simple moving average). You can find that data on altFINS:
10. Risk management. With trading patterns, traders have to do many small trades, instead of few big trades. Because trading is about statistics. Patterns like ascending or descending triangle, channel up or down, resistance break and approach....these have about 70% success rates. That means we're gonna be 30% of time wrong. So traders need to do a hundred trades for these statistics (success rates) to work out. Keep trades relatively small, don't bet the farm on any one trade! Don't use leverage. For additional tips about risk management, read here.
Author: Richard Fetyko, Founder of altFINS, a platform for crypto traders to find trading ideas. altFINS allows traders to screen and analyze over 1,500 coins and 5,000 assets using over 60 technical indicators. The platform also automatically detects chart patterns such as channels, triangles, wedges and key levels (support and resistance), and generates hundreds of trading signals daily.


