
While the market has faced significant headwinds recently, there are growing indicators of a serious potential turnaround in crypto as the following analysis of current trends will show. Despite the fact that it is shaping up to be another rough week for cryptocurrencies, much of the downward pressure stems from specific technical liquidations rather than a fundamental shift in long-term value. For instance, although the Ethereum futures breakdown accelerates, creating short-term volatility, this flushing out of overleveraged positions often precedes a more sustainable price floor. Furthermore, understanding the "why" behind the movement is crucial for spotting a reversal; here’s why Bitcoin dropped sharply back under US$65k, confirming that the dip was driven by internal market mechanics rather than external macroeconomic shocks like tariffs. As these technical corrections exhaust themselves, the stage is being set for a potential recovery.
Ethereum Futures Approaching a Critical Breakout Test Near $2,000
Ethereum futures are trading around $1,972-$1,980, up more than 6% on the session, and now approaching a technically important junction.
On the 4-hour chart, price is pressing into the upper boundary of a potential bull flag structure. The key word here is potential. The pattern is not activated yet. For activation, price must break and hold above the upper rail of the descending channel.
This is where things get interesting.
What is the Ethereum 4-Hour Chart Showing
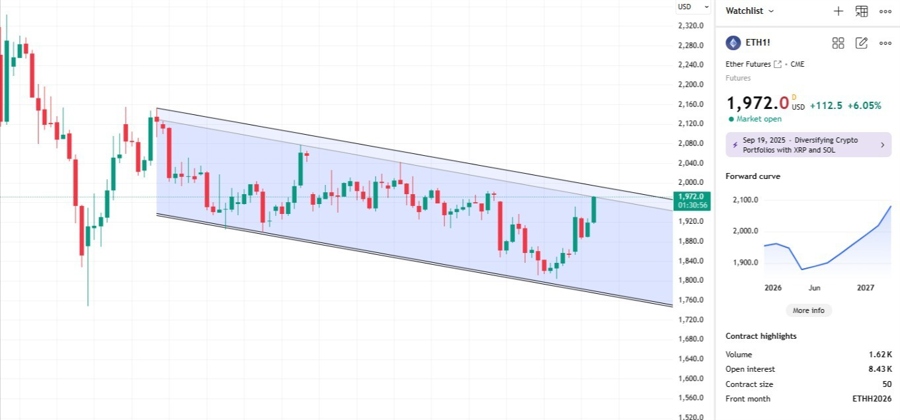
The structure resembles a descending channel that formed after a sharp prior move. That is typical bull flag behavior:
Strong impulsive move
Controlled downward drift (the flag)
Breakout attempt
We are currently at what appears to be the fourth test of the upper boundary (including internal touches of the gray line). Multiple tests increase pressure on resistance. Eventually, resistance either breaks - or rejects decisively.
Right above this upper rail sits the $2,000 psychological round number.
Round numbers matter in crypto because:
They attract liquidity.
They cluster stop orders.
They trigger momentum algorithms.
There are likely short positions with stop orders sitting just above $2,000. If price pushes through that area, it could create a short squeeze acceleration.
However, that outcome is not guaranteed.
Ethereum technical analysis with order flow. What underlying activity suggests
The most important development is what happened at the lows.
Selling pressure increased into the decline, but price did not continue to cascade lower. Instead, the market found responsive demand and quickly rotated higher. That tells us sellers were active, but they were not able to gain sustained control.
As price moved back above the 1,890–1,900 area, participation quality improved. Pullbacks began attracting buyers rather than accelerating lower. In other words, supply was tested - and absorbed.
Now, as price pressed into the 1,930–1,950 region, the key question is whether this higher zone will be accepted or faded. So far, at the time of this analysis, it has not faded. On the other hands, we are still not seeing the explosive volume required to sustain the breakout. Still, we are not there. The US market opens in less than 15 minutes at the time of this writing, it's gonna get interesting in the next couple of hours.
Why This Area Matters So Much for Crypto
Ethereum is still approximately 60% below its all-time high. From a longer-term perspective, if ETH were to eventually reclaim that high, it would represent roughly a 250% upside move from current levels.
That does not mean it happens now. But it explains why structural bullish patterns at depressed levels attract attention.
This junction combines:
Technical pattern pressure (potential bull flag)
Psychological resistance ($2,000)
Possible stop clusters above the level
Institutional crypto ETF sentiment leaning mildly bullish
That is a meaningful confluence zone.
The Etheruem Futures Technical Scenario Framework
Instead of predicting, we map scenarios.
Bullish Activation Scenario for Ether Futures
If Ethereum:
Breaks above the upper channel rail
Pushes through $2,000
Holds above that area on closing basis
Then the bull flag becomes activated, increasing the probability of continuation higher.
Acceleration could occur quickly due to stop-triggering and momentum buying.
Rejection Scenario for Ether Futures
If Ethereum:
Fails at the upper rail
Rejects near $2,000
Slips back into the channel
Then this becomes another lower high within the broader structure. That would open the door for another move toward the lower boundary of the channel.
There is also a possibility of a smaller cup-and-handle type formation developing before any decisive move. Markets often compress before expansion.
What Crypto Traders Might Consider
Those who entered earlier may choose to:
Trail stops higher
Move stops to breakeven
Reduce exposure into resistance
Those waiting for orientation may want to observe how price behaves over the next 1 to 5 sessions. The breakout could happen quickly - even intraday - or it could take several days of compression.
Patience often provides more clarity than anticipation.
Bigger Picture Context for ETH
Ethereum remains significantly below its historical highs. That means upside asymmetry exists if a broader crypto bull phase returns. But upside asymmetry does not eliminate downside risk.
At this stage, ETH futures are sitting at a decision point:
Breakout and expansion
Or rejection and continuation lower
This is a high-potential zone.
It is also a high-risk zone.
As always, use scenario-based thinking and manage risk carefully. The next few days around the $2,000 level could define Ethereum’s next multi-week move.
Stay tuned at investingLive.com where you will get truly authentic new ideas and opinions. At your discretion. Heads up.
--------- LIVE UPDATE ETH FUTURES --------------------------
Micro Ether futures analysis: upside acceptance under test after strong reversal
Market snapshot
About 10 minutes after the US session open, Micro Ether futures are trading near the upper end of the recent multi-session range, pressing into the 1,960–1,975 area after a sharp recovery from the 1,830s.
The broader crypto tone has stabilized, and this larger range structure shows a clear shift from downside expansion to upside rotation.
What underlying activity suggests
On this bigger range view, the most important development is the failed breakdown earlier in the sequence.
There was an aggressive push lower that briefly drove price toward the mid-1,830s. However, that move did not attract sustained follow-through. Instead, the market rotated higher and began rebuilding value at progressively higher levels.
Since then:
Selling pressure into the lows failed to hold.
Buying interest strengthened as price reclaimed the mid-1,900s.
The latest session shows positive participation quality as price presses into prior resistance.
The key question now is not whether buyers can bounce - they already have. The question is whether this higher area will be accepted, or whether it becomes a supply zone again.
Longer-term vs recent behavior
From a broader perspective, the contract had been migrating lower before the flush. That phase now appears interrupted.
More recently:
Price has formed higher lows after the 1,830 rejection.
Rotation upward has shown better stickiness.
Participation on pullbacks has improved rather than deteriorated.
However, the current test near 1,970 is critical. This zone previously acted as resistance, and this is the first meaningful attempt to sustain above it.
Key areas to watch
1,950–1,960 - Immediate support band. Holding above keeps buyers in short-term control.
1,890–1,900 - Structural support from prior acceptance. Losing this would weaken the recovery narrative.
1,970–2,000 - Overhead resistance zone. Acceptance above this area would confirm upside continuation.
Scenarios
Bullish scenario
If price consolidates above 1,950 and continues to attract demand on shallow pullbacks, this would suggest that the prior resistance is transitioning into support. Sustained trade above 1,970 would increase the probability of a push toward the 2,000 region.
Bearish scenario
If price fails to hold above 1,950 and begins accepting back inside the prior balance, especially below 1,900, that would suggest the recovery was corrective rather than structural. In that case, the 1,830 area could come back into focus.
Market bias score
Market bias score: +4 (constructively bullish)
This reflects a meaningful shift in control following a failed downside expansion and strong upside rotation. It is not extreme because the market is still testing overhead supply. A clean acceptance above 1,970 would likely increase the score, while a loss of 1,900 would neutralize it quickly.
What would change the view
Sustained acceptance back below 1,950
Strong downside follow-through after rejection near 1,970
Inability to hold higher lows
Risk note
This analysis is intended for educational and decision-support purposes only. It is not financial advice. Markets are inherently uncertain, and all trading and investing decisions carry risk.
For real-time trade ideas, follow-ups, and market insights across stocks, indices, commodities, and crypto, check out the investingLive Stocks Telegram channel. Trade ideas are shared for educational purposes only and at your own risk.
https://t.me/investingLiveStocks
--------- LIVE UPDATE ETH FUTURES --------------------------
Live Ethereum Analysis – Ether Futures Hold Bullish Structure Above VWAP
Timestamp (UTC): 2026-02-25 15:18 UTC
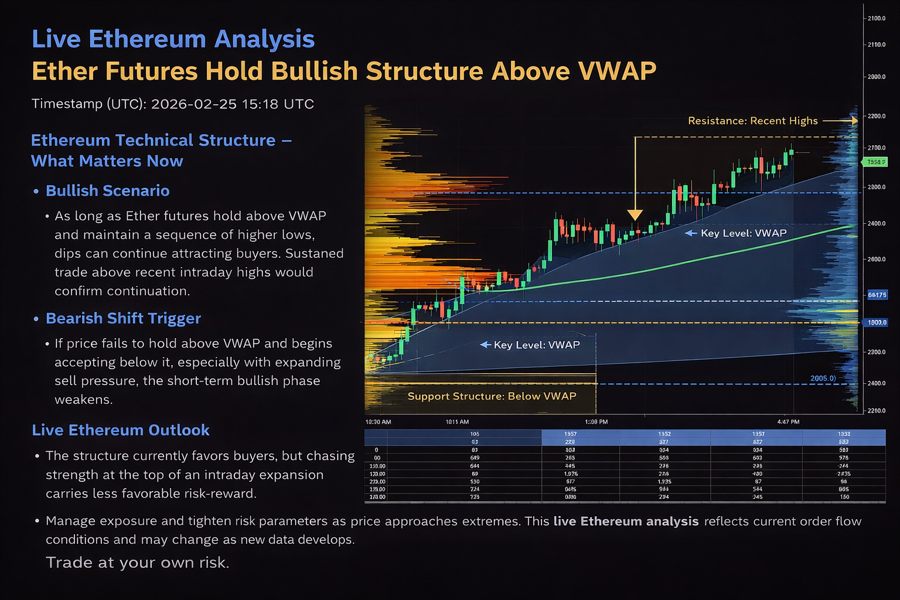
In this live Ethereum analysis, Ether futures (FEB26 contract) are maintaining a constructive intraday structure on the 100-range chart. Price remains above VWAP, and value continues to migrate gradually higher, signaling that buyers still have short-term control.
Order flow shows steady buying interest on pullbacks rather than aggressive distribution at highs. That keeps the near-term bias moderately bullish. However, price is now pushing toward the upper edge of the current intraday expansion, which increases the probability of rotation before any further upside continuation.
Ethereum Technical Structure – What Matters Now
Score is now +5 out of 10, it is bullish and not mild any longer.

Bullish Scenario
As long as Ether futures hold above VWAP and maintain a sequence of higher lows, dips may continue to attract buyers. A sustained move above the recent intraday highs, supported by healthy participation, would confirm continuation and open the path toward further upside extension.
Bearish Shift Trigger
If price fails to hold above VWAP and begins accepting below it, especially with expanding seller pressure, the short-term bullish phase weakens. In that case, a rotation back toward the middle of value becomes the higher-probability scenario.
Live Ethereum Outlook
The current structure favors buyers, but chasing strength at the top of an intraday expansion carries less favorable risk-reward. Traders may consider managing exposure actively, scaling partial profits into strength, and tightening risk parameters as price approaches upper extremes.
This live Ethereum analysis reflects current order flow conditions and may change as new data develops.
Trade at your own risk. https://t.me/investingLiveStocks


