
I am looking at Etherum via the Ether futures chart looks like a market that is trying to stabilize and mean-revert after a very volatile March.
In plain English, ETH had a strong upside push, failed to hold the higher prices, and is now rotating back toward the area where the market has done the most business. That is often what a mean-reversion phase looks like. Price is no longer in a clean impulsive uptrend, but it is also not collapsing. It is searching for balance.
Ethereum price structure explained
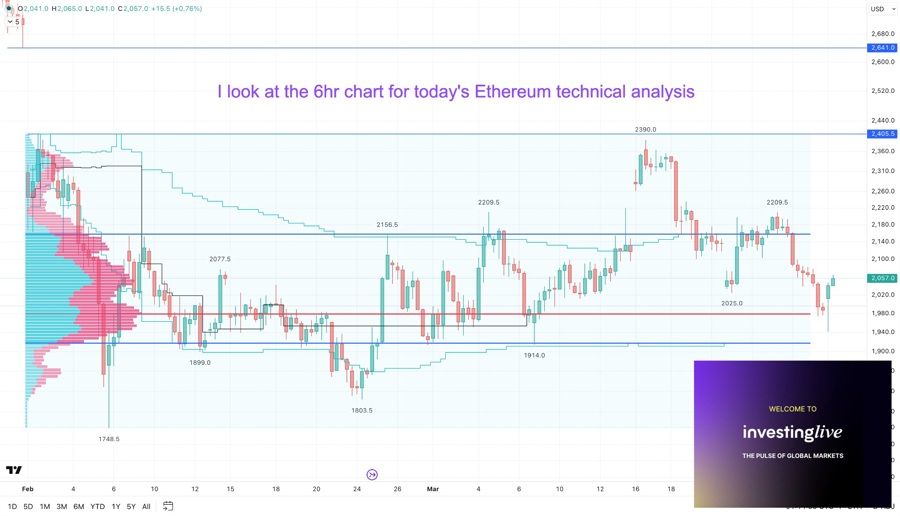
ETH is trading around $2,054, which is a respectable bounce, but the larger structure still shows some technical damage from the failed rally into the $2,390 area. That push higher was rejected, and since then the market has been unable to fully reclaim the more important overhead levels.
The main resistance levels on my chart above are still $2,156.5 and $2,209.5. These acted as important ceilings during March. For bulls, that is the area that needs to be retaken and then held. Until that happens, the recent recovery is better described as a bounce inside a broader rebalancing process rather than a confirmed new uptrend.
On the downside, the chart shows a very important lower framework around $1,980, then $1,914, then the March swing low near $1,803.5. If the market were to lose those levels in sequence, the deeper floor near $1,748.5 would come back into view.
Ethereum technical analysis today: Volume profile and market balance
The visible profile on the left has a fairly D-shaped look, which is often associated with a more balanced market. Educationally, that matters because a D-shape usually tells you the market is spending time agreeing on value, not trending aggressively away from it.
The heaviest trading seems concentrated roughly between $1,950 and $2,080, which helps explain why price is currently gravitating back into that zone. This is where the market has memory. When price is inside that thick part of the profile, it often chops, rotates, and tests both sides before choosing its next directional move.
That also fits with the idea of stabilization. ETH is no longer in the fast upside auction that carried it toward $2,390. It is now back near its more accepted value area.
An important educational point here is the thinner volume zone above roughly $2,210. Thin areas tend to mean less historical friction. So if ETH can reclaim and hold above the nearby resistance, price can sometimes travel faster through those zones because there is less prior trade there to slow it down. That is why a successful break above $2,156.5 and especially $2,209.5 could open the way back toward $2,390 to $2,405.
The technical analysis educational corner: Mean reversion and why it matters
Mean reversion does not automatically mean bullish. It simply means the market is moving back toward its central value area after becoming stretched.
That is a useful lens for this chart. ETH sold off from the highs, found support, and is now trying to hold around the area where the market has previously accepted price. In technical analysis terms, the current question is whether this is only a temporary return to fair value before another leg lower, or the early stage of a more durable base.
Ether's forward curve and broader context
The forward curve shown on the right is in contango, with later-dated ETH futures priced above the nearer contract. Educationally, contango usually suggests the market is willing to price somewhat higher levels in the future (which is typically "healthy" for the bullish case). It often reflects carry, time, and a market that is not pricing long-term stress as severely as the short-term chart may imply.
That said, contango is not the same thing as immediate bullish momentum. The short-term chart still matters. ETH remains below the March highs, and the failure to sustain the move above the mid-March resistance zone leaves a lower-high style structure in place until proven otherwise.
Practical reading of the chart
A simple way to frame the chart is this:
$1,980 is the key pivot and balance area
$2,156.5 to $2,209.5 is the overhead gate bulls need to reclaim
$1,914 is the next important support if the bounce fades
So the educational takeaway is:
If ETH can continue to hold above the high-volume middle of the range (advanced tip: Watch $2118 in Ether futures, above that, bulls are good... And give it some time to see it's not a "fakie") then the chart starts to shift from stabilization into recovery. If the bounce stalls again under resistance and slips back through the pivot zone, then the market is probably not done testing lower support.
In practical terms, this is a chart of rebalancing after failed upside expansion, with the next directional clue likely coming from how price behaves around $1,980 on the downside and $2,156.5 to $2,209.5 on the upside. In between? Remember the key level of $2118 and watch it for guidance, IMHO.
Ethereum technical analysis today: What to does the order flow tell us?
Prediction Score: +6
Score context: On a scale from -10 to +10, a +6 reflects a clear bullish bias with solid conviction, but not an extreme or one-sided setup.
After I checked the order flow at Ether futures, the analysis shows that this week opened with a bullish tone in ETH futures.
The main reason is that the order flow picture points to buyers gaining the upper hand early and then maintaining that advantage instead of fading quickly. In our heavier internal read of the opening sequence, the important takeaway is that buying pressure was not isolated to just one brief push. It showed enough follow-through to suggest a firmer opening tone.
A few things stood out:
Delta stayed constructive overall, with several positive pushes that helped confirm buyer control rather than a weak or easily rejected bounce.
POC shifted higher and then held there, which is an important clue that the market was willing to do business at stronger prices instead of immediately rotating back down.
The opening sequence also showed a healthier pattern of participation, with buyers repeatedly stepping in after minor interruptions rather than losing control of the tape.
That combination is why the tone leans bullish. It is not just about one strong bar. It is about the quality of the opening sequence and the fact that price discovery appeared to stabilize at firmer levels.
The cautious counterpoint is that an opening can look strong and still lose momentum later. So this is not an automatic call for nonstop continuation. But based on the order flow evidence from the completed opening block, the balance of evidence still supports a moderately strong bullish read.
Bottom line for this week's opening order flow at Ethereum:
ETH futures opened the week with a bullish tone, supported by constructive delta behavior and a higher, stable POC. Our orderFlow Intel analysis at investingLive.com suggests buyers did enough early on to justify a +6 bullish score, while still leaving room for later confirmation. Visit investingLive.com for additional, original views.
Ethereum Today: Beware of the News. Here are the highlights I am looking at
The Fed Factor (Liquidity Watch)
Markets are in a holding pattern ahead of Fed Chair Powell's speech later today. Crypto thrives on liquidity; a dovish tone could spark a "risk-on" rally, while hawkish rhetoric will likely trigger a "risk-off" retreat to the US Dollar.
Geopolitical Chaos (Inflation & Uncertainty)
The Middle East is flashing confusing signals. President Trump claims Iran negotiations are going "extremely well", but physical escalation tells a different story. Following Tehran blackouts, Trump is now targeting Iran's oil. This threatens an inflationary energy shock that could force the Fed to keep rates high. Meanwhile, the conflict is widening, with Israel intercepting drones from Yemen's Houthis.
The Crypto Takeaway: Correlated Asset or Digital Gold?
These converging events will test crypto's narrative:
Risk-Off: If oil spikes from the Middle East conflict and Powell remains hawkish, expect crypto to dump alongside traditional equities as liquidity dries up.
Decoupling/Hedge: If Bitcoin catches a bid as a "safe haven" against fiat instability and wartime inflation, crypto could ignore the macro chaos entirely and break upward.
Last, a power tip from investingLive.com to our crypto community: Watch the DXY (Dollar Index) during Powell's speech. A surging dollar spells trouble, but a softening dollar amid the geopolitical noise is the green light crypto bulls are waiting for.

Remember: No one has a crystal ball and markets can change. Do not take the above Ethereum technical analysis as any promise and you must always do your own research and if you trade or invest, do that that at your own risk only. The above is for educational purposes only.


