
Bitcoin Futures Analysis for the End of the Week with tradeCompass
Yesterday’s Ethereum tradeCompass was a success. The bullish threshold was activated, two profit targets were reached, and as per our methodology, the stop was moved to the entry after the first or second target. When Ethereum reversed later, the second half of the position was stopped at breakeven — the first half secured profit, the second was neutral, resulting in a winning trade overall.
This highlights how tradeCompass operates. It’s primarily designed for short-term traders but is also suitable for swing and even long-term traders in cases where major reversal zones are identified. Most of the time, however, it focuses on key technical levels during the week or even within the day, helping traders engage around the most active price zones.
Those following our trade ideas on the investingLive.com Stocks Telegram Group know that we typically move the stop to entry after taking partial profits — often after the first or second target. This structured approach allows the strategy to secure wins even if the move turns out to be a retracement rather than a full trend continuation. Another key principle: one trade per compass. Once a bullish or bearish side is triggered, that’s the only direction traded for that setup.
Ethereum Follow-Up
Ethereum futures continue to lean bearish. If price sustains below $3,800, there’s room for further downside toward $3,555, signaling a potential continuation of the broader crypto cooling phase.
Bitcoin Futures Short Setup
Following that temporary crypto rebound, Bitcoin remains within a bearish structure. The goal of this setup is to align with the potential continuation of that broader decline if the price retraces into our predefined sell zone. These are not random levels — they’re derived from our analysis of VWAP deviations, value area dynamics, and liquidity pools.
Setup details:
1st Sell: 107,645
2nd Sell: 108,275
3rd Sell: 108,800
Average Entry: 108,240
Stop: 110,225 (+1.83%)
TP1: 105,885 → take one-third off (+2.18%)
TP2: 103,380 → take another third (+4.49%)
TP3: 93,590 → leave the final third open (+13.54%), targeting a potential breakdown below $100,000
Blended Reward: ~3.7R
All entries and exits are equal in size. Once TP1 is reached, move the stop to entry to protect the rest of the position. The last third aims to capture an extended bearish leg if a liquidity flush occurs under the 100K zone.
Bitcoin Technical Analysis on the Daily Chart: Bears are in Control after Anchored VWAP was not Protected
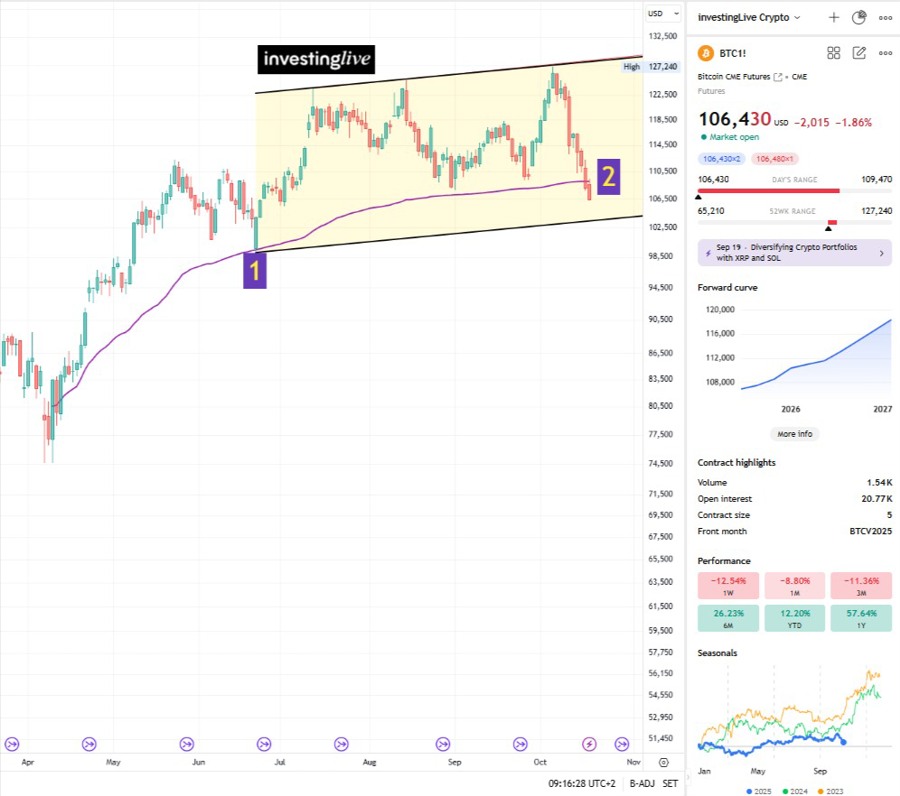
On the daily chart above, Bitcoin is currently trading around $106,430 and testing a critical technical structure:
The purple line marks the anchored VWAP from the April low — an important pivot point that previously attracted strong buyers.
At Point 1, after touching this anchored VWAP, price reacted strongly to the upside.
At Point 2, however, buyers failed to defend that same VWAP, suggesting weakening demand.
The yellow channel illustrates the broader trading range that has contained Bitcoin since May. With the VWAP defense broken, the next logical destination could be the lower boundary of this channel, aligning with roughly the $100,000 area. This level is also a psychological round number, where many stop orders and pending liquidity are concentrated.
If price approaches this level, we could see one of two outcomes:
- A liquidity run — market makers triggering stops and reversing upward, or
- A bear flag breakdown, confirming deeper downside momentum below 100K.
Either way, it’s a zone where large players are likely to engage, making it a crucial area to monitor over the coming sessions
Educational Corner – Understanding the Tools Behind tradeCompass
VWAP (Volume Weighted Average Price)
VWAP reflects the average traded price weighted by volume. It’s widely used as a real-time fair value benchmark. When price trades above VWAP, it indicates relative strength; when below, relative weakness. Standard deviation bands around VWAP highlight how far price has stretched, helping traders spot potential exhaustion zones for reversals or breakouts.
Value Area (VAH & VAL)
The Value Area High (VAH) and Low (VAL) define where approximately 70% of the total traded volume occurred during a session. These levels reveal where most traders agreed on price value. Breaks outside these areas often precede either strong directional trends or false breakouts that quickly reverse once large orders are absorbed.
Liquidity Pools
Liquidity pools are clusters of stop orders or pending orders around psychologically or technically significant prices — like previous highs/lows, VWAP deviations, or round numbers such as 100,000 in Bitcoin. Market makers often drive price toward these pools to trigger liquidity events before reversing. Identifying these zones allows traders to anticipate where large participants — the “strong hands” — are most likely to act.
Together, VWAP, the value area, and liquidity mapping form the analytical backbone of tradeCompass. These tools help detect where high-probability opportunities exist and where the market might pivot due to the behavior of major participants.
Final Note for Crypto Traders Today (17 Oct, 2025)
This analysis is for educational purposes only and not financial advice. The purpose is to help traders understand how price interacts with volume, liquidity, and key technical structures — and how to manage trades with discipline.
To follow our daily tradeCompass updates and market insights, join our Telegram group at https://t.me/investinglive_stocks, where you will find, among education, trade ideas on a variety of tradable assets - futures, stocks, commodities, FX pairs, crypto. Always at your own risk only, we never provide financial advice.
