
Bitcoin Futures Technical Analysis on the daily chart
Many times, I like to look at a few charts and include a very simple one like the following:
Oh, and it does not mean that I am buying on the next possible touch point of the price on that trend line. I like to watch, first. Often I look how this sort of charts may fake others out.
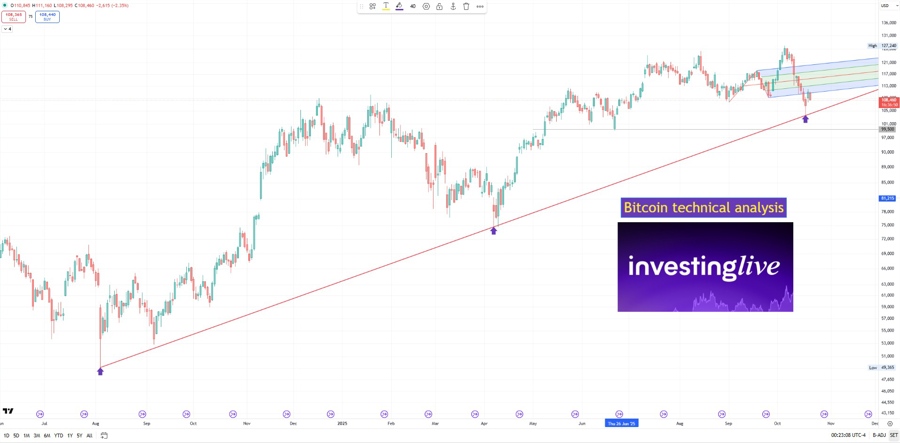
But before I dive into today and going forward, what did we have yesterday? Yesterday’s pop was real; today’s giveback is telling. On our daily futures chart, price bounced off the rising red trendline on Friday 17 October, then rallied about 4.12 percent yesterday, and is down more than 2 percent so far today. The bounce pierced the pitchfork you see on the chart and even nicked the August lows near 108,400, which keeps the discussion honest. My base case is that the market will want to retest that red line at some point; a later liquidity sweep near the round 100,000 level would not surprise, especially with 99,500 sitting almost on the June low that many will defend.
One simple perspective that many algos and discretionary traders will track is the rising trend line marked in red. Price tagged it cleanly and bounced on Friday 17 October 2025, two trading sessions ago on the futures chart. After that retracement up, it is reasonable to expect a return to test that line. If sellers press, market makers may attempt a liquidity run around the 100,000 round number, which sits below the trend line and would sweep resting stops. Keep the 99,500 junction on the radar as well, since it sits close to the June low and often attracts reactive flow.
Remember that technical analysis is not about a single chart or a single idea. The craft is to know what others are watching, even when those levels are later used to fake them out and stop them out. The red trend line, the psychological 100,000, and the 99,500 pocket are three reference points likely to shape behavior in the next legs.
For broader context, performance is mixed, one week minus 6.33 percent, one month minus 7.36 percent, three months minus 9.99 percent, yet six months still plus 15.40 percent, year to date plus 14.32 percent, and one year plus 57.17 percent. If you want the backdrop on the recent slide, see our coverage on investingLive, Bitcoin slumps to fresh four month lows, technical trouble continues to brew, and our follow up Bitcoin trade idea as bears regain control, join the short.
Options color, IBIT read
Across the iShares Bitcoin Trust options, implied volatility is 44.4 with a one year percentile of 49, so roughly mid range but rising. IV is 9.7 percent above its 20 day IV average of 40.4, and 13.6 percent above the 20 day historical volatility at 39.1. Translation; options markets are pricing more movement than we have realized lately, though not at panic levels. That favors owning a little time and being selective when selling front week premium.
Strategy notes for options users
Range or two sided view, calendars and diagonals work well when front maturities carry lower IV than back months.
Directional but risk controlled, prefer debit spreads to naked calls or puts at these IV marks.
Hedgers with spot or micro futures, a simple collar on IBIT can smooth the path while preserving participation.
Positioning pulse for crypto now
Fresh flow is cooling a touch; the latest twenty four hour long volume is down 15.40 percent to about 54.15B, and twenty four hour short volume is down 10.74 percent to about 58.41B. Shorts still outsize longs, which fits a cautious tone, yet both sides reduced activity, which often precedes a test of nearby levels before the next committed leg.
Traders at Ethereum can also look at lower key levels as Ethereum futures also activated bearish threshold, according to tradeCompass.
The tradeCompass map for bitcoin traders today
Think of this as a map, not a prediction. Act where price accepts, not where it merely wicks.
Bearish premise while below 109,250
That level sits near the September twenty fifth value area low, a key line from the volume profile view. As long as futures remain under it, I treat the setup as bearish with waypoints to manage risk and expectations.
107,750, near the October sixteenth value area low
107,250
106,700
106,325, the October seventeenth VWAP
105,300
If price slices through and holds below those junctions, the red trendline retest comes into view; a later liquidity run around 100,000, with 99,500 just above the June pivot, is a realistic scenario.
Bullish alternative on sustained strength above 110,000
If buyers take control and hold over 110,000, the path opens toward 111,500, then 112,450, then 113,000. Acceptance matters; a quick spike is not enough.
Compass reminder for new readers: Treat the thresholds as activation lines. If price lingers under the bearish line, short setups have the advantage. If it powers and holds above the bullish line, longs have the advantage. After the second profit target is reached, move the stop to entry to protect gains and manage the runner.
Why this matters for crypto today and this week
Risk assets had a strong Monday, the Nasdaq added about 1.28 percent, yet Bitcoin outperformed on the day and is now underperforming on the pullback. That mix often signals urgency from active sellers in crypto for the session, which reinforces the value of trading the levels rather than the emotion of a single candle.
What bitcoin traders and investors should know
The bounce is not invalidated, yet the failure to build above 109,250 keeps bears in charge until proven otherwise.
Options are pricing a bit more future movement than recent realized swings; structure matters.
Round numbers attract flows; watch the behavior near 110,000 on the upside and the 100,000 to 99,500 pocket on the downside.
If you want to follow some trade ideas (and not only on crypto), you are welcome to join our investingLive.com Telegram channel at https://t.me/investingLiveStocks
Disclaimer: This analysis is for informational purposes only and is not financial advice. Trading and investing in financial markets involve risk, and you should conduct your own due diligence before making investment decisions.
