
Bitcoin CME futures are having a clearly bearish session, down close to 5% on the day, and the broader structure shows a market that has shifted from “rally continuation” into “value repair.” In plain English: after strong upside days earlier this month, the market stopped rewarding buyers, rolled over, and is now spending time building trade at lower prices.
This Bitcoin technical analysis uses investingLive.com’s orderFlow Intel framework to translate what is happening behind the candles, focusing on buyer vs seller pressure, value acceptance, and whether today’s stabilization near support is a real base or simply a pause inside a bearish trend.
orderFlow Intel is decision support, not financial advice. Trade at your own risk.
Let's first dive in my 2 technical analysis video overviews for today's bitcoin futures:
Bitcoin technical analysis context: what changed since the Jan 13-14 rally?
On the daily view, the powerful push higher on Jan 13 and Jan 14 has been “undone” quickly, with price already breaking below the Jan 13 low. That matters because strong trend legs usually hold their prior breakout zones. When those zones fail quickly, it often signals that the prior rally was more fragile than it looked.
On top of that, the market has been unable to reclaim key reference areas from the prior session(s), including prior value zones and VWAP references. That reinforces the idea that this is not just a healthy pullback.
Today’s VWAP and value area tell a bearish story
On the 30-minute chart, today’s VWAP started near $92,500 (around yesterday’s POC) and has been sliding lower. At the time of this read:
Today’s VWAP: about $91,516, clearly declining
Today’s POC: about $91,000–$91,045
Today’s VAH: about $91,745
Today’s VAL: $90,640
Yesterday’s VWAP: about $93,075
Two points matter for Bitcoin technical analysis traders:
The entire value area today is below yesterday’s key references. That is value migration lower.
Price has spent roughly the last 12 hours below VWAP without a meaningful test. When a market cannot even rotate back to VWAP, it usually means sellers are controlling “fair value,” and buyers are reacting rather than leading.
This does not guarantee continuation lower, but it does define the playing field. Bulls need to prove themselves by reclaiming and holding key levels. Until that happens, rallies tend to behave like “sell-the-rally” opportunities, not trend continuations.
The key support level: why $90,640 matters so much
The level that keeps showing up across timeframes is $90,640, today’s value area low and an important lower reference on the intraday structure. This is where many traders start talking about a “double bottom” or “base building,” especially after a hard selloff.
Here is the problem: candles alone cannot tell you if that base has real demand behind it. A sideways cluster can be either:
Real dip buying that absorbs selling and prepares a reversal, or
A pause that simply lets selling pressure cool before the next leg lower
That is where orderFlow Intel helps. It tries to answer a simple question: when price pauses at support, are buyers actually taking control, or are sellers just temporarily resting?
What orderFlow Intel sees right now: bearish control, but execution is neutral
Across the higher intraday range-based view (used for momentum and acceptance) and the shorter range-based view (used for execution), the message is consistent:
Sellers had a real impulse lower earlier in the session.
The market is now digesting that move, not reversing it.
Buyer activity exists, but it has not produced the kind of “follow-through” you would want to see if a durable base was forming.
In practical terms, this often creates the most frustrating environment for traders:
Shorting late can be dangerous because snap-back rallies happen easily after a big drop.
Buying early can be dangerous because pauses near support can break down once liquidity builds.
So the highest-quality decision support is not “go long” or “go short.” It is: wait for the market to reveal whether $90,640 is being defended strongly, or whether it is being accepted below.
Bitcoin technical analysis map: the levels that matter next
Use this as your decision-support compass. The market is currently in a bearish auction, but it is pausing. That pause will resolve either upward into a larger rotation, or downward into continuation.
Bearish levels to watch
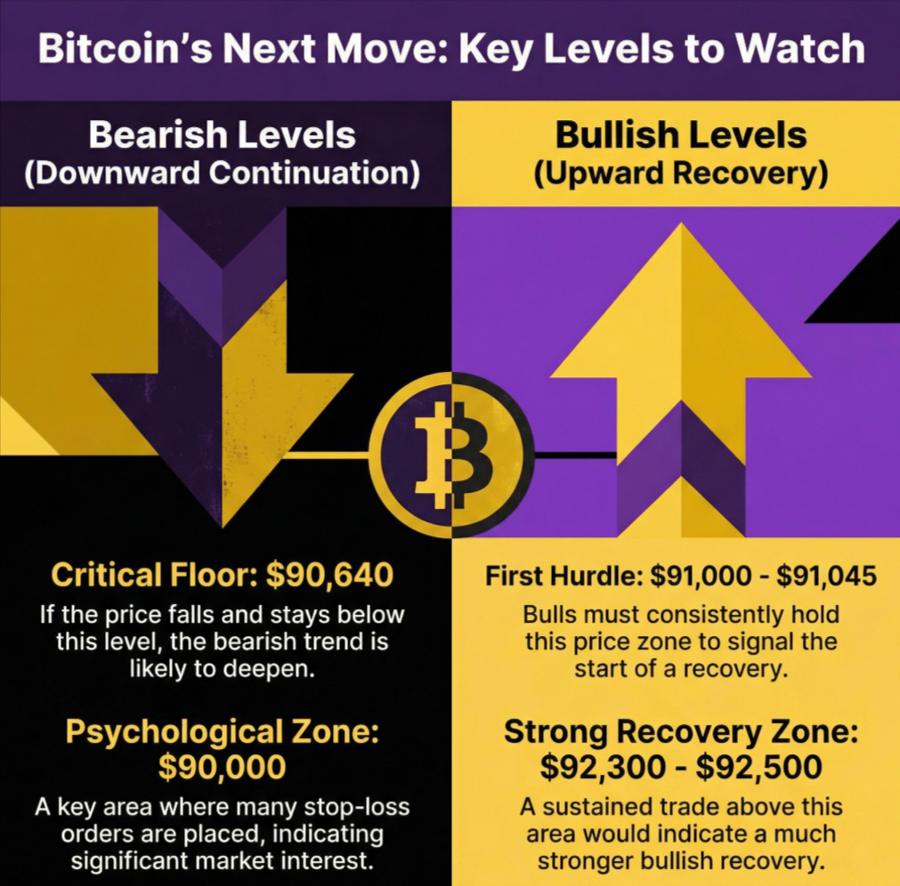
$90,640 (VAL): the main “floor” level in focus
$90,000 (round number zone): psychological liquidity area where stops often sit
If price accepts below $90,640, the bearish stage typically deepens, and the next downside references from the daily structure come into play (including the larger support zone around the low $80,000s highlighted earlier in your daily context).
Bullish recovery levels to watch
$91,000–$91,045 (POC zone): first area bulls need to hold consistently
$91,745 (VAH): the first meaningful “reclaim” level
$91,516 (today’s VWAP, declining): bulls need not just a tag, but sustained trade above it
$92,300–$92,500: a stronger recovery zone (prior references and the area where today’s VWAP began)
A useful rule of thumb:
If price cannot sustain above the bullish thresholds (VAH, VWAP, then the next resistance band), shorts can become more attractive on rejection.
If price breaks below the bearish threshold (VAL), it often signals that the auction is accepting lower and continuation risk rises.
What the orderFlow Intel scores are, and how to use them
orderFlow Intel assigns a score from -10 to +10. The score combines three things:
Direction: positive is bullish bias, negative is bearish bias
Confidence: larger magnitude means stronger evidence
Timing risk: the score avoids extreme readings when price is already extended and late entries are risky
It also uses three timeframe buckets so we do not mix “structure” with “execution.”
Score Summary
Long-term score (Daily / LTF): -4
The daily structure is bearish. The prior rally zone failed quickly, and value has shifted lower. This is not a strong trend breakdown score, but it is clearly negative.Medium-term score (200-range / MTF): -3
Sellers remain in control intraday, and the market has not repaired value upward yet. However, momentum has slowed, which prevents a more extreme bearish score.Short-term score (100-range / STF): 0
This is the most important score for actual trade execution. A 0 means “no edge right now.” The market is pausing and compressing. That often produces chop and false moves. You typically wait for confirmation.
How traders can use this:
When the long-term and medium-term scores are negative, you treat rallies as suspicious until the market proves otherwise.
When the short-term score is near 0, you avoid forcing trades and instead wait for the next clean signal around the key levels.
Scenarios for Bitcoin today: continuation vs rotation
Scenario 1: Bearish continuation
This becomes more likely if:
Price breaks below $90,640 and holds below it
Bounces fail to reclaim the $91,000–$91,745 zone
VWAP continues drifting lower and price remains pinned below it
In this case, the market is communicating that it is accepting lower prices, and downside targets expand.
Scenario 2: Rotation and stabilization
This becomes more likely if:
Price holds $90,640 and starts building value higher
The market reclaims $91,745 (VAH) and then spends time above it
Price rotates back to VWAP and starts holding above VWAP rather than rejecting it
This does not instantly make Bitcoin bullish again on the daily chart, but it can shift the intraday trade environment from “sell pressure” to “two-sided balance.”
A quick educational note: why failed VWAP tests matter in Bitcoin technical analysis
Many traders treat VWAP like a line on the chart. In reality, it is a live “fair value reference” used widely across institutional and systematic flows.
When price spends hours below VWAP and cannot even test it, it often means:
sellers are controlling the auction, and
buyers are not willing to pay up enough to challenge fair value
That is why today’s declining VWAP, combined with a lack of VWAP tests, keeps the bias bearish unless conditions improve.
Bottom line for Bitcoin technical analysis today
Bitcoin remains in a bearish intraday auction, and the market is still trading well below yesterday’s key references. The interesting development is not that bulls are winning, but that selling has paused near $90,640, creating a decision point.
If $90,640 breaks and holds below, bearish continuation risk rises.
If Bitcoin reclaims $91,745 and starts holding above VWAP, the market shifts into rotation and stabilization.
Until one of those conditions is met, the best decision-support stance is patience. The chart is bearish, but the execution edge is not clean right now.
Trade at your own risk. Come check more out at the investingLive Telegram Channel on https://t.me/investingLiveStocks
