Bitcoin Futures Analysis Today: How orderFlow Intel Maps Key Levels After Breakout and Consolidation
While I'm still thinking back to my first bitcoin technical analysis of 2026, where I state my opinion that 100k is still open for the short term, I know that many of you crypto traders are looking at what will happen today.
Bitcoin futures are entering a critical consolidation phase after reclaiming important value levels earlier this week. While standard charts may suggest indecision, deeper order flow-based analysis points to a market that is digesting gains rather than breaking down.
At investingLive.com, we apply orderFlow Intel, a professional decision-support framework that studies how volume, participation, and price acceptance interact beneath the surface of the market. I mean, many of you can see that bitcoin is doing pretty good since Nov 21 (up almost 20% since then till today's high, in Bitcoin futures), even hitting its highest in a couple of months. But for today, we look beyond the obvious and these order flow insights are typically not available to most retail traders, and the goal is to do the heavy analytical lifting and translate it into a clear, usable map.
This update is not financial advice, but structured guidance to help traders and investors think more clearly about risk, context, and probabilities.
The bigger picture: why structure still matters more than short-term noise
On higher timeframes, Bitcoin futures continue to display a constructive structure:
Price has reclaimed and held above prior value areas from early January.
High-activity zones from previous sessions have gradually shifted higher.
Downside attempts have so far lacked follow-through.
From an order flow perspective, this behavior often signals acceptance at higher prices, rather than distribution. In healthier bullish phases, markets tend to rotate, consolidate, and rebuild participation instead of collapsing immediately after a rally.
Educational reminder:
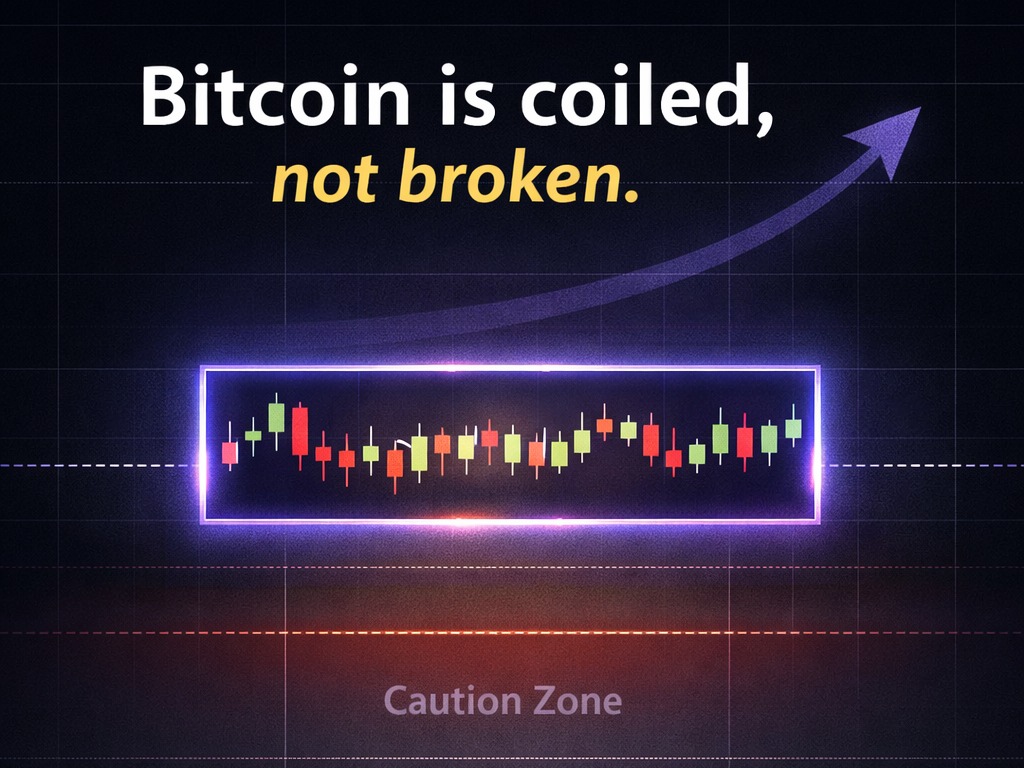
Strong markets do not move in straight lines. Consolidation near prior resistance is often a sign of digestion, not weakness.
Why Bitcoin feels “stuck” despite a bullish backdrop
On shorter timeframes, Bitcoin futures are currently trading inside a balanced zone, with price oscillating around the session’s average.
orderFlow Intel highlights several important dynamics:
Two-sided trade near the mean, rather than one-sided dominance.
Sellers appearing near resistance, but without aggressive continuation.
Buyers stepping in on pullbacks, even if they are selective.
In simple terms, the market is deciding whether to build value higher or briefly rotate lower to attract more participation.
Educational tip:
When price stalls near resistance without strong selling pressure, it often reflects a lack of urgency rather than a bearish signal.
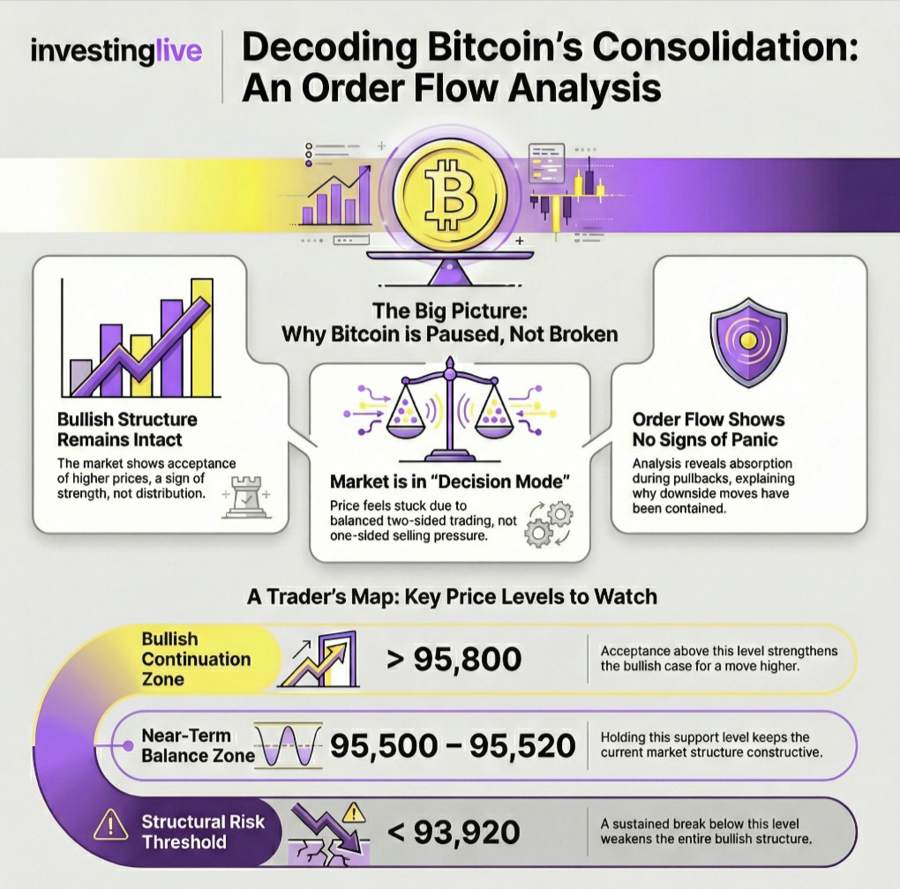
Key price levels Bitcoin traders should watch
These levels are not arbitrary. They are derived from where meaningful trading activity previously took place, which is why markets often react around them.
Bullish continuation zone
95,780–95,800
Acceptance above this area would indicate that buyers are willing to transact at higher prices, increasing the probability of continuation toward:
96,300–96,400, followed by higher resistance zones beyond.
For this scenario to gain traction, price needs to hold above this area, not just briefly trade through it.
Near-term balance and support
95,500–95,520
This zone represents the lower boundary of the current consolidation. Holding above it keeps the structure constructive and supports the idea of sideways digestion rather than trend failure.
First downside reaction area
94,580
This is an important prior high-activity area from early January. If price pulls back here, traders should observe how price behaves:
Stabilization or rejection would support the broader bullish case.
Clean acceptance below would increase caution.
Educational tip:
High-volume areas often act as “decision points” where markets pause, react, or reverse temporarily.
Structural risk threshold
93,920
Sustained acceptance below this level would weaken the bullish structure and suggest that Bitcoin futures may need more time to rebuild support.
Why order flow adds value beyond standard charts
Most traders rely on candles, indicators, and moving averages. orderFlow Intel focuses on how much participation supports price movement and whether that movement is being accepted or rejected.
Currently, order flow analysis suggests:
No signs of panic or forced selling.
No evidence of aggressive liquidation.
Continued absorption during pullbacks.
This helps explain why downside moves have been contained and why rallies, even when hesitant, have not failed decisively.
Educational reminder:
Price moves supported by participation tend to persist. Moves without acceptance often fade.
Short-term caution, medium-term constructive bias
The current environment rewards discipline over aggression.
Short-term traders should expect rotations, false starts, and tests of patience.
Medium-term participants should focus on whether price holds key support during pullbacks or accepts above resistance during rallies.
This is often the phase where markets attempt to shake out impatient positioning before revealing a clearer directional move.
The investingLive decision compass for Bitcoin traders
Think of this analysis as a map, not a forecast:
Above 95,800, the bullish case strengthens and higher levels become relevant.
Below 95,500, patience is warranted as the market tests balance.
Below 93,920, structural risk increases and bias should be reassessed.
Professional traders rarely act on a single signal. They wait for price to interact with important levels and then evaluate the response.
orderFlow Intel is designed to support better decision-making, not to predict outcomes. Markets are probabilistic, not certain, and all trading involves risk.
This analysis reflects current conditions and will evolve as new data comes in.
Stay patient, stay level-aware, and let price behavior confirm the next move.
