
Fundamental Overview
The uncertainty about a December cut has been weighing on bitcoin ever since Powell delivered his infamous line saying that a December cut was not a foregone conclusion. The lack of official US data and cautious stance from Fed members didn’t help either.
Given the overstretched positioning in risk assets and the higher general volatility of the cryptocurrency market, bitcoin experienced one of the worst months since 2022.
The cryptocurrency rebounded on Friday though as Fed’s Williams suggested that he would support a rate cut in December. That saw the December rate cut odds jumping immediately to 60% giving the cryptocurrency a boost.
As things stand, a rate cut in December is now more likely and that should support bitcoin heading into the meeting.
We have a holiday-shortened week due to Thanksgiving on Thursday, but we will still get two important economic data like the weekly ADP report tomorrow and the most recent US Jobless Claims on Wednesday. Soft data should keep the hopes for a December cut high.
Bitcoin Technical Analysis – Daily Timeframe
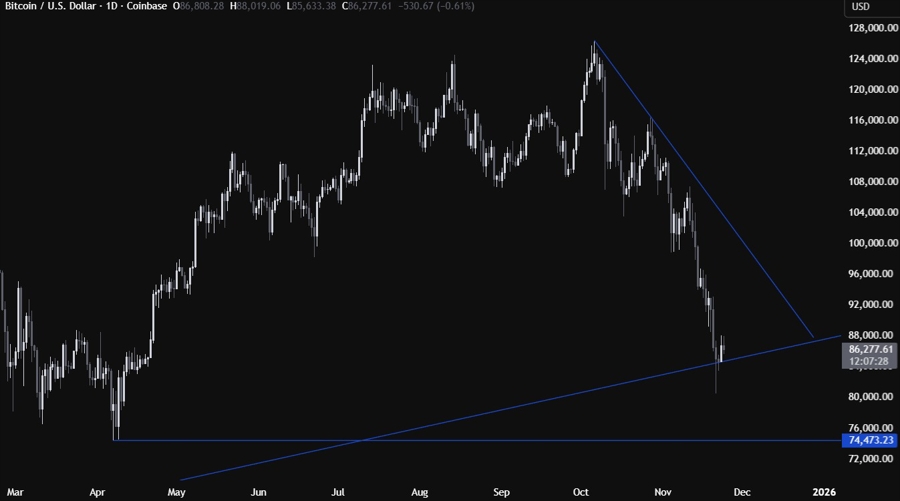
On the daily chart, we can see that Bitcoin broke below a major trendline on Friday but eventually bounced back following Fed’s Williams’s support for a December cut. The buyers will likely pile in here with a defined risk below the trendline to position for a rally into the downward trendline. The sellers, on the other hand, will want to see the price breaking lower again to extend the drop into the 74,474 level next.
Bitcoin Technical Analysis – 4 hour Timeframe
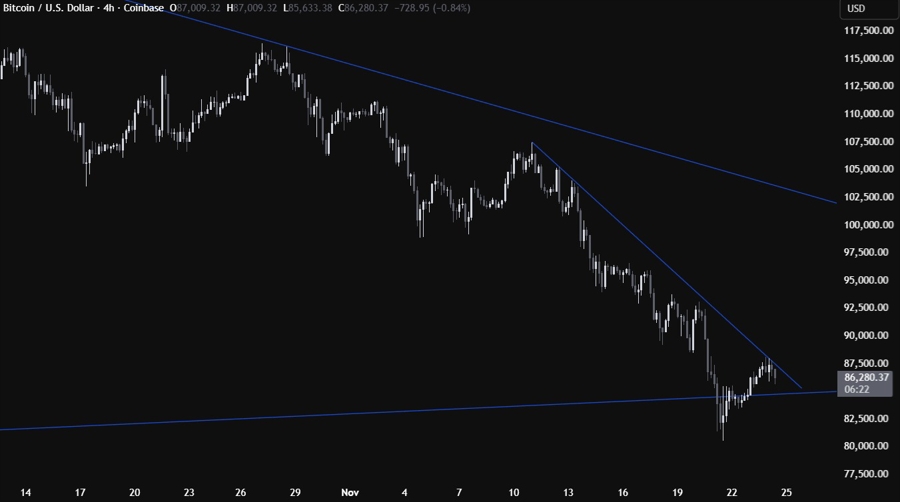
On the 4 hour chart, we can see that we have a minor downward defining the bearish momentum on this timeframe. The sellers will likely continue to lean on the trendline to keep pushing into new lows, while the buyers will look for a break higher to increase the bullish bets into the next major trendline.
Bitcoin Technical Analysis – 1 hour Timeframe
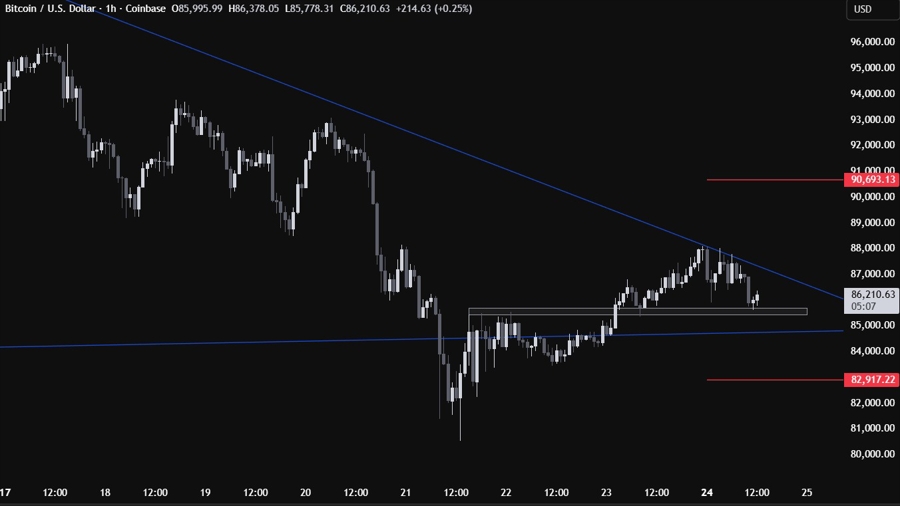
On the 1 hour chart, there’s not much else we can add here as the buyers will want to see the price breaking above the trendline to get more conviction for new highs, while the sellers will keep on leaning on the trendline to keep pushing into new lows. The red lines define the average daily range for today.
Upcoming Catalysts
Tomorrow we get the weekly ADP jobs data and the US Consumer Confidence report. We will also get the September US PPI and Retail Sales reports. On Wednesday, we get the most recent US Jobless Claims figures and the September Durable Goods Orders report. On Thursday, we have the US Thanksgiving holiday, so the final part of the week will likely see a rangebound market.


